Similarweb 2026 Complete Tutorial: Traffic, Channels, Keywords & Competitors
Master Similarweb's proper usage and data boundaries through seven steps: website overview, traffic engagement, competitors, channels, outbound links, rankings, and tech stack.
Open article contents
When you want to know "where competitor traffic comes from," "which channels are growing," or "which pages users visit most," looking only at your own website's Google Analytics data isn't enough. You need a tool that can observe the market and competitors from the outside, and Similarweb is one of the most representative products in this category of digital intelligence platforms.
This article will explain Similarweb's positioning, core features, common metrics, version differences, and tool selection from the ground up, and demonstrate through 7 real page operation steps how to analyze website overview, traffic engagement, competitors, marketing channels, outbound links, website rankings, and technology stack.
What is Similarweb
Similarweb is a digital intelligence and competitive analysis platform. After users enter a website domain, they can view traffic trends, user engagement, channel composition, popular pages, search keywords, audience geography, and competitive relationships for that website.
Its most important value is not "accurately counting your own website," but helping you observe other websites and entire industries from the outside. Therefore, Similarweb is particularly suitable for the following tasks:
- Competitor Research: Understand competitors' traffic scale, growth trends, and main customer acquisition channels.
- Market Trend Analysis: Compare the market performance of multiple brands across different countries, devices, and time periods.
- Marketing Channel Analysis: Assess the contribution of channels such as organic search, paid search, social media, display advertising, email, and referral links.
- SEO & Content Research: Discover the keywords, landing pages, and content themes that drive traffic to competitors.
- Business Due Diligence: Quickly evaluate the online influence of target websites before partnerships, investments, or entering new markets.
In one sentence:Google Analytics is more like "looking at yourself," while Similarweb is more like "looking at the market and competitors."
Where Does Similarweb Data Come From
Most competitive website data shown by Similarweb is not directly read from the other party's backend, but is estimated through modeling from multiple data sources. Its data system typically includes:
- Anonymized real user behavior signals;
- Data provided by partners and data suppliers;
- Public signals such as public web pages, website structures, and search results;
- Data actively connected and verified by website owners;
- Calibration and estimation through statistical models and machine learning.
Therefore, Similarweb is better suited to answer relative questions like "who is bigger," "which channel is stronger," or "is the trend rising or falling," rather than treating any estimated value as an absolute number like a financial statement.
Usage principle: When analyzing your own site, use GA4, server logs, or internal BI data as the standard; when analyzing competitors, prioritize trends, proportions, and relative differences rather than worrying about single-digit errors.
Similarweb Free Version Hands-On Tutorial
Below, using openai.com as the demonstration domain, we'll walk through the complete Similarweb official free website analyzer. Readers can replicate most steps without logging in.
Open the following address and replace the domain at the end with the website you want to analyze:
https://www.similarweb.com/website/openai.com/
Alternatively, go to the Similarweb homepage and enter the full domain in the search box. When entering, only the domain is needed, for example example.com, without adding https://, page paths, or query parameters.
Screenshot note: Images in this section are based on Similarweb's official public pages, with data captured in July 2026. For easier understanding by Chinese readers, interface text has been localized to Simplified Chinese; values are for demonstration purposes only and will change with subsequent months.
Before operating, confirm three filter conditions
After entering the report, don't immediately copy the numbers. First check the filters at the top of the page:
- TimeFree pages usually display recent months or the last few months; paid versions can view longer historical periods.
- Device/Traffic ScopeMay include desktop, mobile, or all traffic. Data from different devices cannot be directly compared.
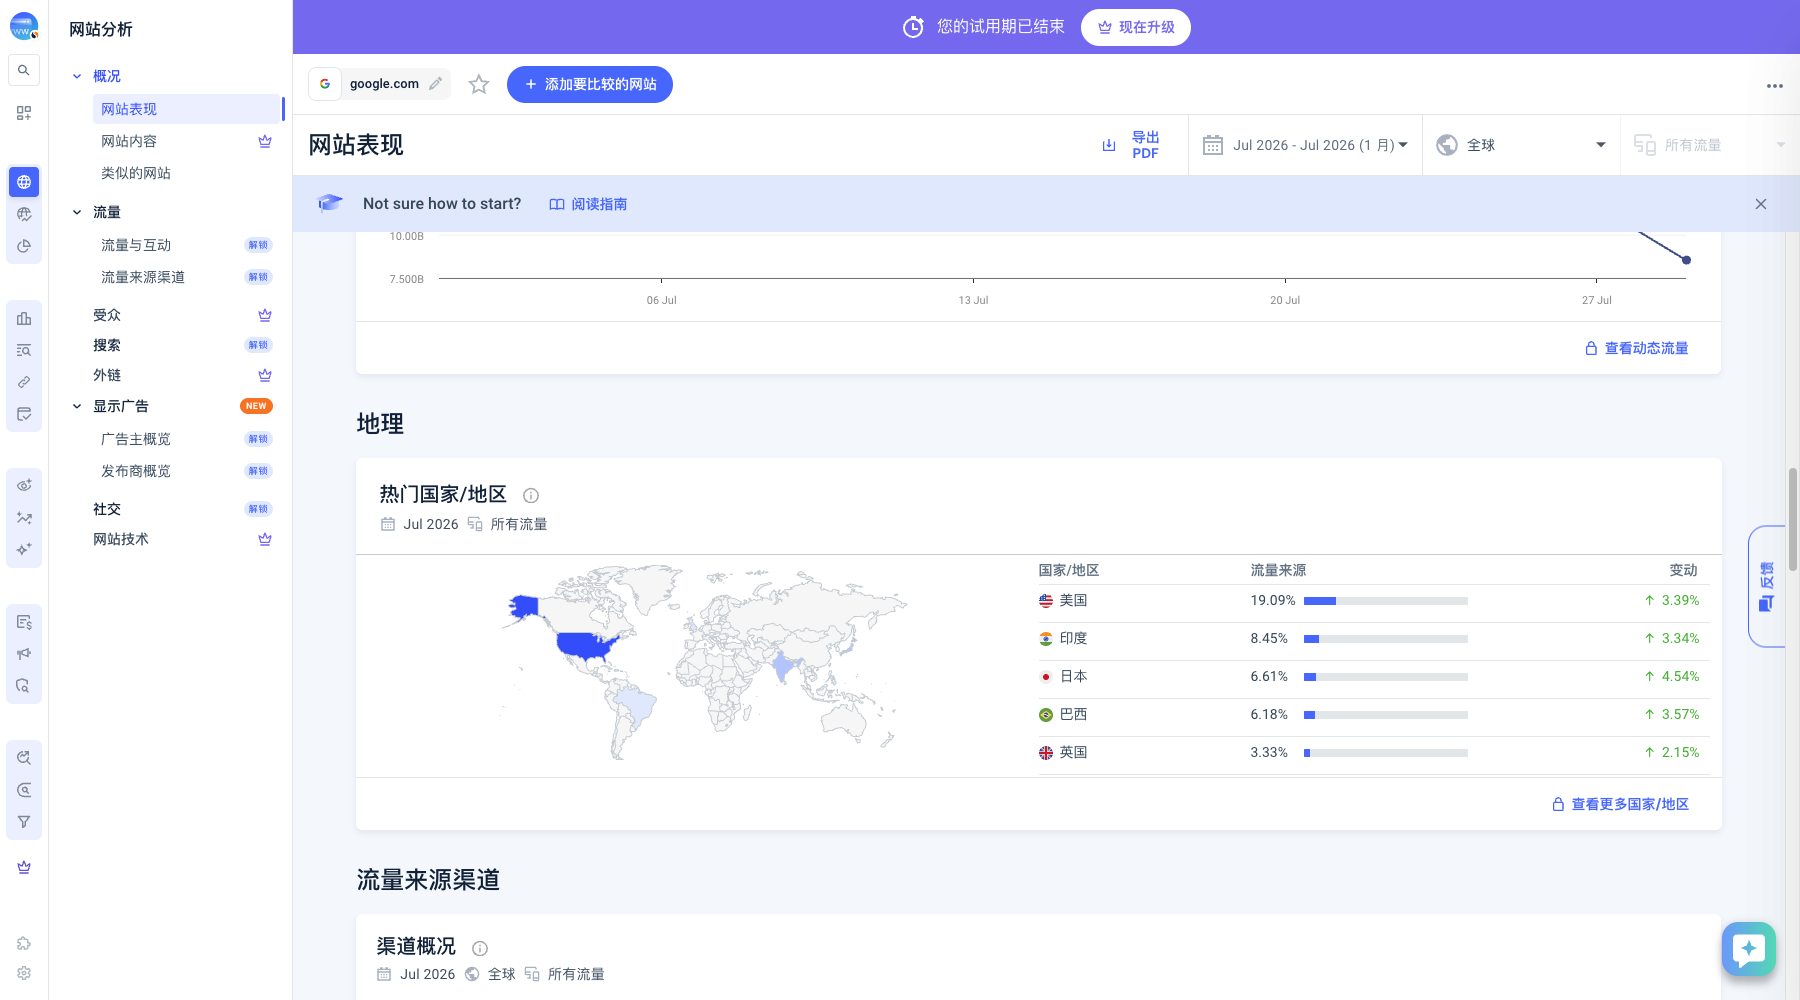
- Country or RegionGlobal data is suitable for judging overall scale; country data is suitable for studying local markets.
When comparing multiple websites, all reports must maintain the same time, country, and device criteria. Otherwise, the "traffic gap" may simply be caused by different filter conditions.
Step 1: Enter the domain and view the website overview
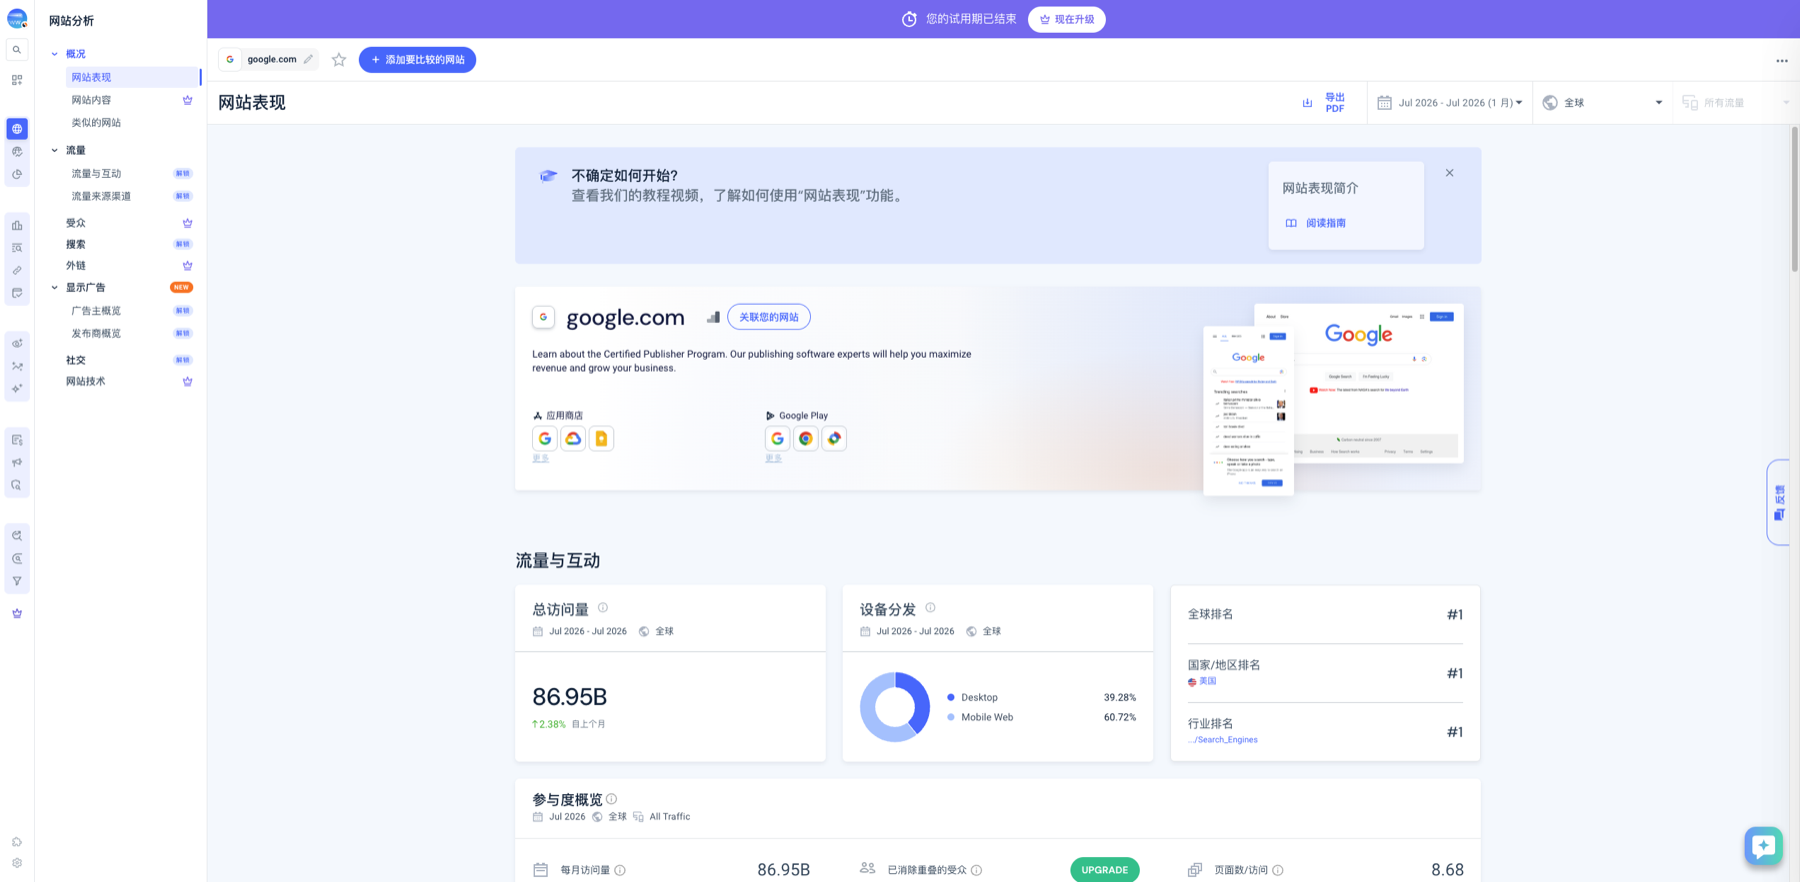
The website overview is the entry point for analysis, mainly containing the following information:
- Website Name and DescriptionUsed to confirm whether the analysis target is correct, with special attention to the differences between main domains, subdomains, and brand official websites.
- Company InformationMay include company, founding year, number of employees, headquarters, and industry classification.
- Global RankThe website's overall position among all websites tracked by Similarweb.
- Country/Region RankThe website's position in major countries or selected countries.
- Category RankThe website's relative position within its industry.
Smaller rank numbers indicate higher positions. For example, a category rank changing from 8th to 5th usually represents relative performance improvement, but not necessarily absolute traffic growth, as other websites may have declined simultaneously.
What to record on the overview page | Item | Record Content | Purpose |
|---|---|---|
| Analysis Domain | Main domain or subdomain | Avoid analyzing the wrong target |
| Primary Country | Country with the highest traffic | Determine subsequent localization scope |
| Industry Category | Similarweb classification | Find similar competitors |
| Global Rank | Current value and changes | Observe overall influence |
| Category Rank | Current value and changes | Judge industry relative position |
If a website cannot display traffic or rankings, it's usually not an operational error, but rather insufficient sample size, too short time since launch, or traffic mainly occurring in environments difficult for Similarweb to observe.
Step 2: View traffic scale and engagement quality
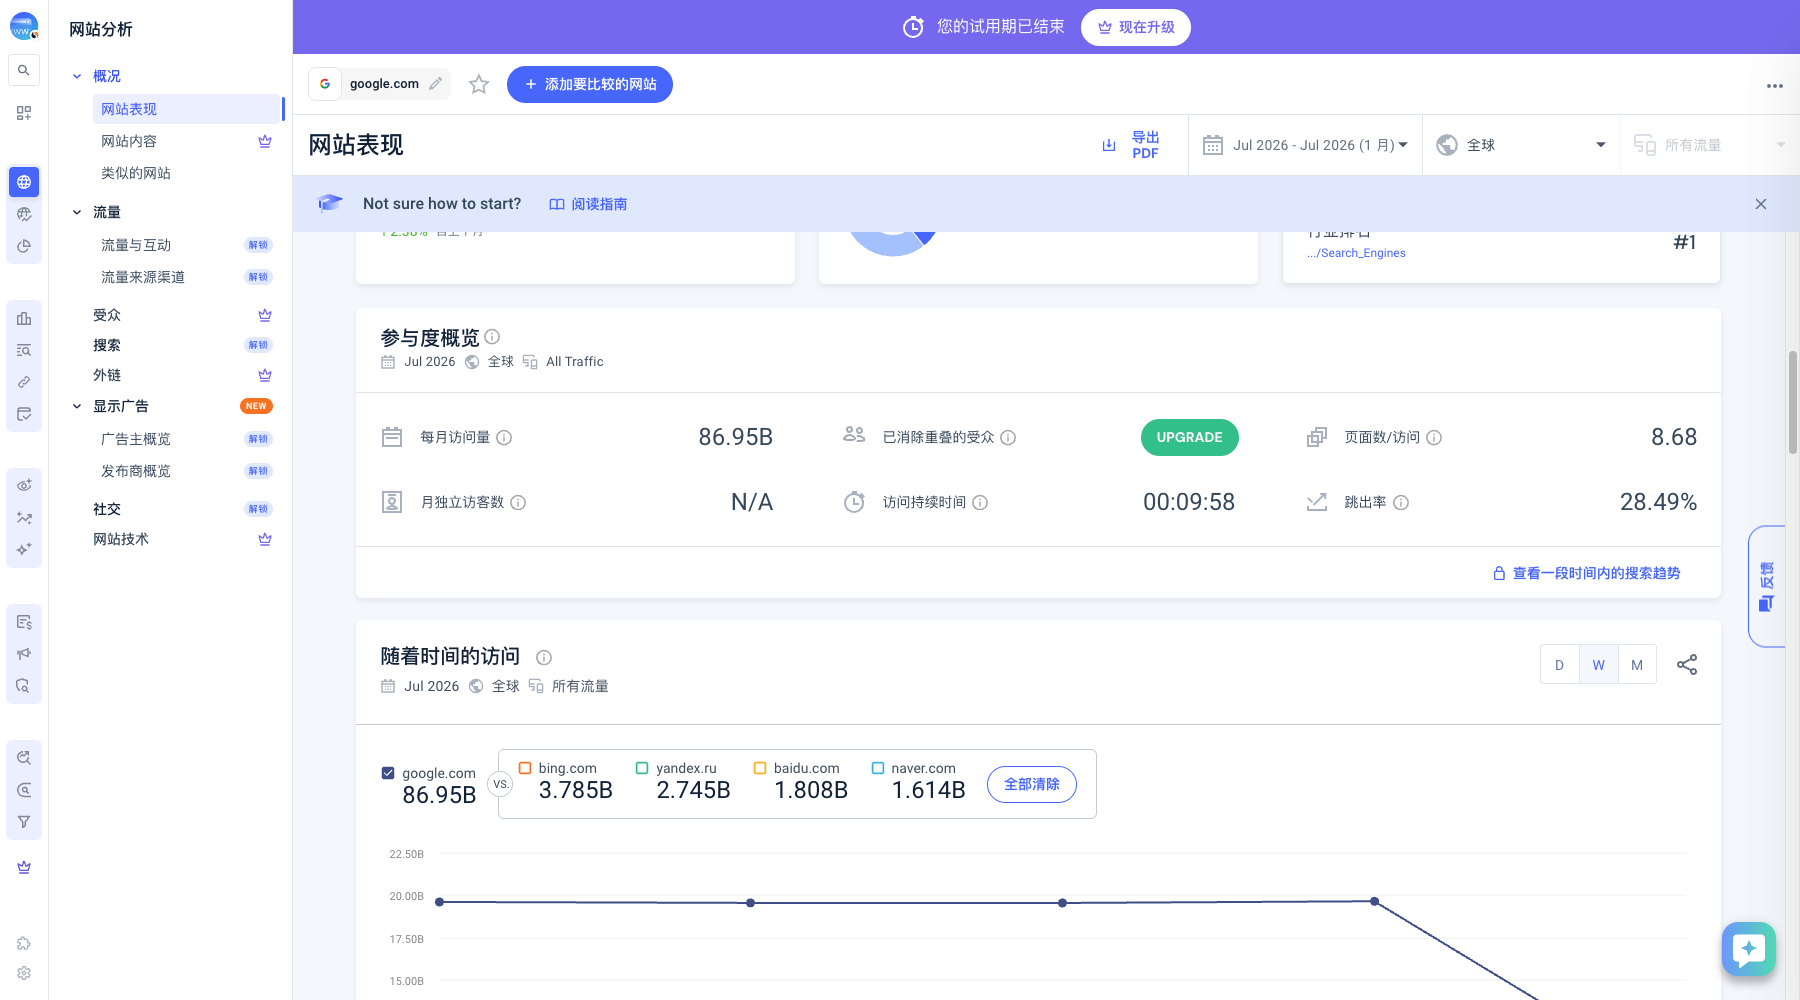
Click "Audience" on the left, and the page will navigate to Traffic & Engagement Analysis。
This section is the core for judging website scale and user quality. Common metrics include:
- Change from last monthHow much it grew or declined compared to the previous month.
- Total VisitsThe number of visits generated within the time range, not equal to unique visitors.
- Bounce RateThe proportion of visits that ended after viewing only one page.
- Pages per VisitHow many pages a user browses on average per session.
- Average Visit DurationHow long a session lasts on average.
- First look at the 3-12 month trend to determine if it's a long-term change or a single-month fluctuation;
- Then look at total visits to judge the website's scale;
- Finally, look at bounce rate, pages per visit, and visit duration together.
For example, if visits increase but visit duration and pages per visit decrease simultaneously, it may mean the new traffic quality is relatively low; if visits decrease but user engagement improves, it may mean low-quality channels were reduced. You cannot judge a website's quality based on a single metric alone.
Different industries cannot be directly compared horizontally - Search tools, weather queries, and currency converters may complete tasks in one visit, resulting in higher bounce rates;
- Content communities or online courses usually have longer visit durations;
- E-commerce websites may have higher pages per visit than single-page SaaS official websites;
- News events can cause short-term traffic spikes but don't necessarily bring stable users.
The most reliable comparison target is not the "average of all websites," but competitors in the same industry, with similar scale and similar business models.
Step 3: Discover real competitors and similar websites
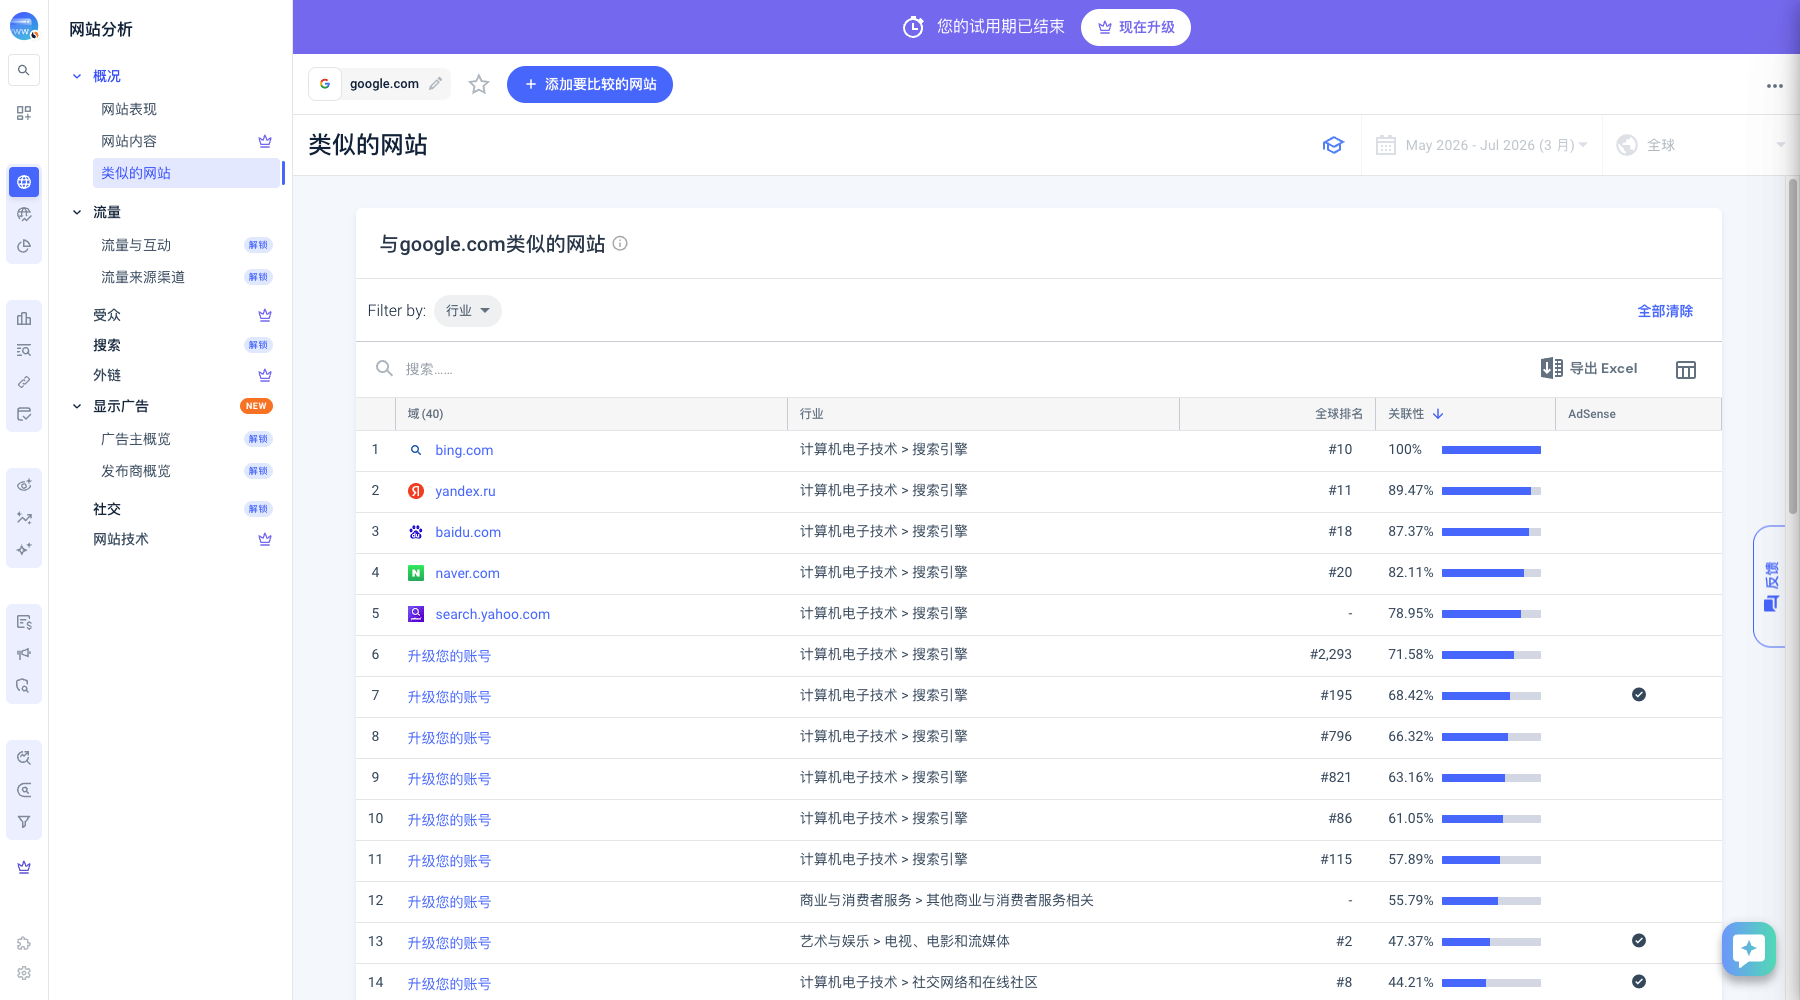
Click "Competitors" on the left to enter Competitors & Similar Sites。
The list typically includes:
- WebsiteIdentified similar domains;
- SimilarityHow close two sites are in audience, industry, or browsing behavior;
- CategoryThe category the other site belongs to;
- Category RankThe other site's position within its category.
This list may differ from the "business competitor list" compiled by the team based on experience. The reason is that Similarweb reflects actual online user visit relationships: users may visit a content community, tool site, and brand official website simultaneously. These sites may not sell the same products, but they compete for the same attention.
How to Filter Competitors Worth Researching Divide candidate sites into three categories:
- Direct CompetitorsSimilar products, customers, and business models;
- Search CompetitorsDifferent products, but competing on the same keyword results pages;
- Attention CompetitorsCompeting for the same user time or budget.
Prioritize 3-5 sites most relevant to your business for comparison. Too many competitors will make line charts and channel tables difficult to read.
Step 4: Break Down Traffic Sources and Identify Growth Channels
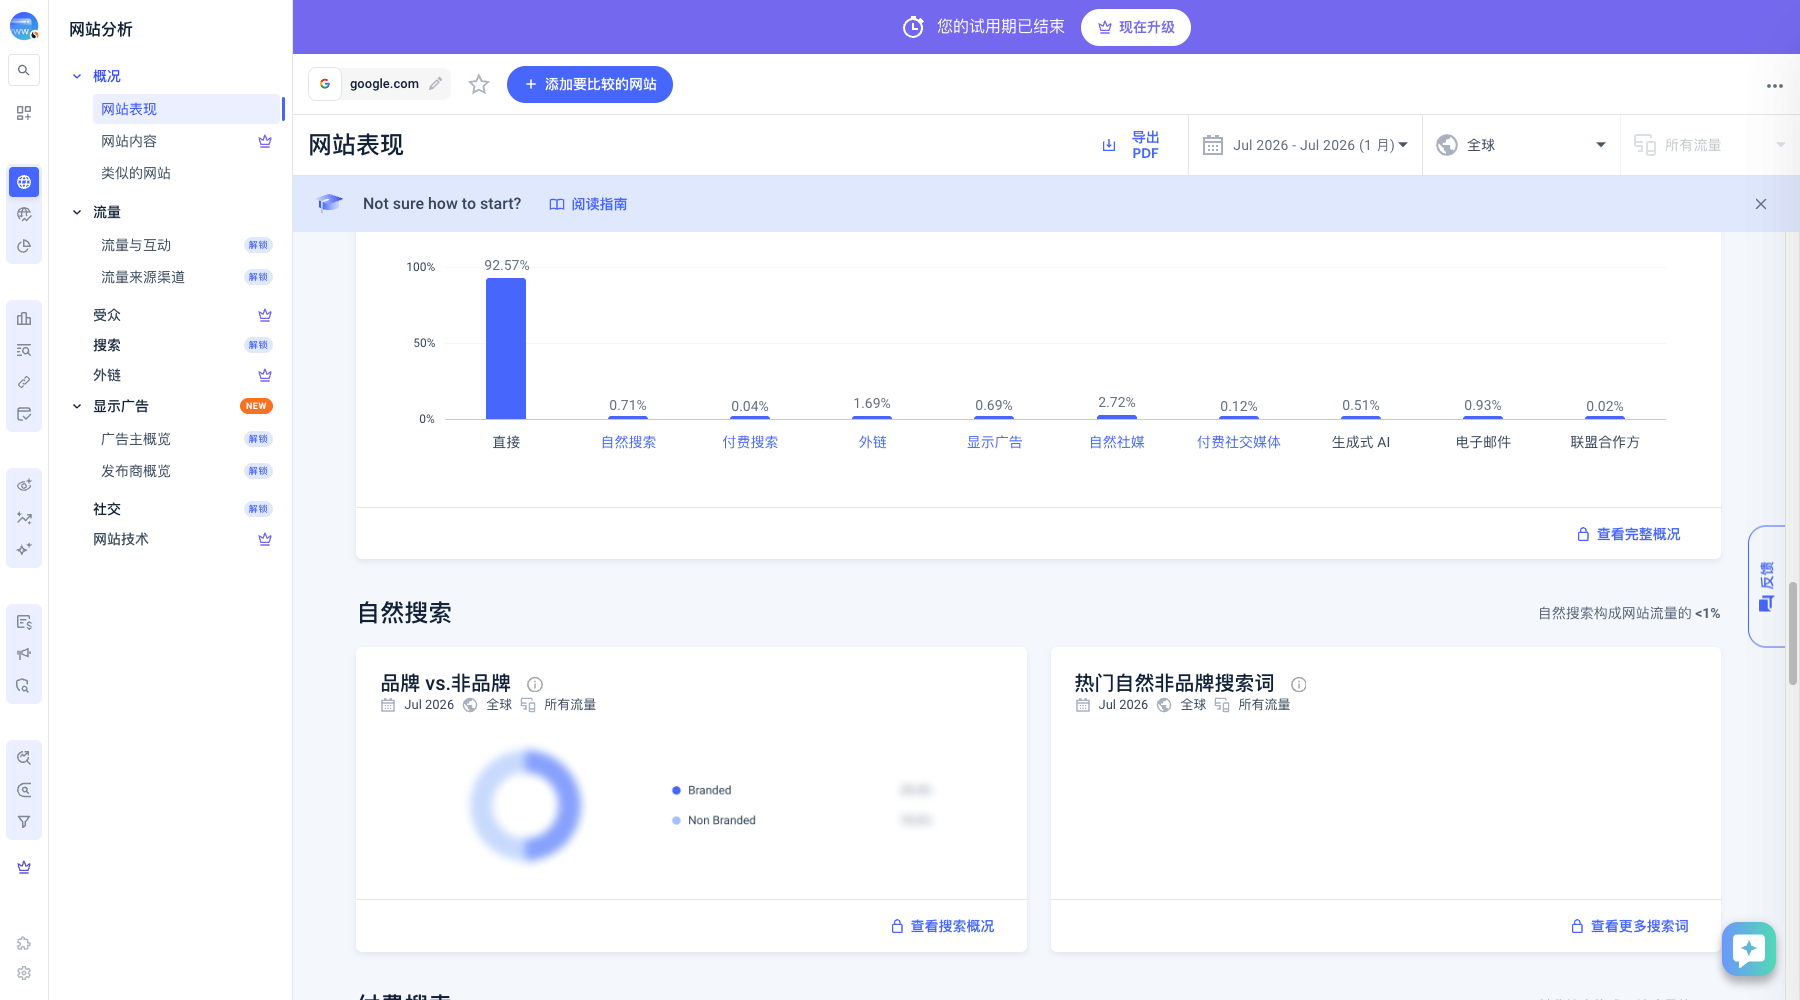
Click "Marketing Channels" to enter Top Traffic Sources。
The channel report answers "where users come from". Common channels and their meanings are as follows:
| Channel | Typically Represents | What to Check Next |
|---|---|---|
| Direct | URL entry, bookmarks, App redirects, or unidentifiable sources | Brand awareness, offline activities, private domain traffic |
| Organic Search | From non-ad search results | Keywords, popular content, ranking pages |
| Paid Search | From search ads | Target keywords, ad copy, landing pages |
| Referrals | From links on other websites | Media coverage, affiliates, partners |
| Social | From social platforms | Platform distribution, content formats, influencer partnerships |
| Display Ads | From banner, native, or programmatic ads | Creatives, media, campaign duration |
| From identifiable email clicks | Newsletter, automated emails, event notifications | |
| Generative AI | From AI services like ChatGPT, Gemini, Claude | Cited pages, brand mentions, question topics |
- High Direct TrafficStrong brand awareness, or possibly App or unattributed private domain traffic.
- High Organic SearchContent and SEO are key growth engines; continue analyzing keywords and popular pages.
- High Paid TrafficGrowth may rely on ad budget; observe if spending is sustained.
- High Social TrafficIdentify which platform drives it; avoid mistaking one viral hit for long-term capability.
- Highly Concentrated ChannelsAlgorithm changes, platform policy shifts, or budget cuts pose higher overall traffic risk.
Channel share only shows structure. To judge if a channel is truly growing, also check its absolute visit volume and time trends.
Step 5: See Where Users Go After Leaving
Click "Outgoing Links" to enter Outgoing Links。
Outgoing Links shows which sites users click to from the target site. It differs from "backlinks" in SEO tools:
- Outgoing LinksFocuses on where users go after leaving the target site;
- BacklinksFocuses on which pages link to the target site.
This report can be used to discover:
- Primary conversion or registration destinations;
- Payment, login, help center, and partner domains;
- Brands or merchants that e-commerce sites direct to;
- Platforms frequently referenced by content sites;
- In the user journey, the target website plays the role of entry point, comparison, or transit.
If a certain external domain accounts for a high proportion, further determine whether it is a subsystem of the same company, a third-party service, or a business partner—do not directly treat it as a competitor.
Step 6: Use Ranking Trends to Determine Relative Position
Click "Rankings" to switch between category, country/region, and global metrics.
The ranking report is suitable for quickly determining whether "relative position has improved." When reading, note:
- A change in ranking from 20 to 10 is an improvement;
- Category rankings are more suitable than global rankings for observing vertical industry competition;
- Country rankings are suitable for evaluating local markets;
- Ranking changes do not equal year-over-year traffic changes—both should be viewed together;
- Websites with similar rankings are often valuable new competitor leads.
It is recommended to record category rankings monthly rather than checking daily. Short-term minor fluctuations usually have no strategic significance.
Step 7: Identify Technologies and Services Used by the Website
Click "Tech Stack" to enter Technology Stack。
The tech stack report lists third-party technologies that the website may use by category, such as:
- Content management systems;
- Web analytics and conversion tools;
- Payment and currency services;
- Video and media services;
- Advertising, marketing automation, and customer support tools.
It is suitable for sales lead research, technology selection, and migration assessment. For example, when selling analytics, payment, or marketing tools, you can first determine whether the target customer is already using competing products.
Note: Technology identification usually comes from public scripts, web tags, and other observable signals. A tool may only be used on some pages, or may have been discontinued but still visible in cache, so important conclusions require manual verification.
What Is Missing in the Free Version Operations So Far
Public pages can complete quick research, but the in-depth features mentioned in the original text are mainly located in the paid platform, such as:
- Splitting data by country, device, and longer time ranges;
- Custom competitor groups and dashboards;
- Complete keyword lists, keyword gaps, and search ranking tracking;
- Paid search, display advertising, and ad creative analysis;
- Popular pages, website segments, and conversion analysis;
- Market size, market share, and demand analysis;
- App Intelligence, AI Search Intelligence;
- Excel batch export, API, data warehouse, and BI integration.
If the free version can already clearly identify channel or competitor gaps, then consider purchasing paid modules for the corresponding issues. Do not subscribe just because there are "many features"—first define the business questions that need to be answered each month.
What Problems Can Similarweb Solve
1. Who Are My Competitors
Some competitors come from business common sense, while others come from users' actual visiting behavior. Similarweb can discover websites not originally on your monitoring list based on audience overlap, keyword overlap, and industry affiliation.
2. Why Has the Competitor Grown Recently
When a competitor's traffic suddenly increases, you can further break down the sources of growth:
- Organic search growth: possibly new content, ranking improvements, or algorithm changes;
- Paid search growth: possibly concentrated bidding on certain keywords;
- Social traffic growth: possibly short videos, community topics, or influencer partnerships;
- Direct traffic growth: possibly reflecting brand awareness, app referrals, or offline activities;
- Referral traffic growth: possibly media coverage, affiliate partnerships, or important backlinks.
3. What Do Users Really Care About
By analyzing popular pages, keywords, and on-site search topics, you can determine what products, content, or solutions users are looking for. This information can be used for content planning, landing page design, product planning, and ad creative development.
4. Is the New Market Worth Entering
Comparing data across multiple countries or regions can help teams determine:
- Whether overall market demand is growing;
- Whether top brands are already highly concentrated;
- Which channels are most effective locally;
- How large the gap is between you and local competitors.
Six Core Metrics Worth Paying Attention To
Visits
Represents the number of visits a website receives within a specific time period. It is suitable for measuring website scale and trends, but does not equal unique users. The same person visiting multiple times will generate multiple visits.
Visit Duration
Reflects how long an average visit lasts. Higher duration usually indicates engaging content, but should be judged in context of website type. For example, normal duration for tool sites and news sites may be completely different.
Pages per Visit
Indicates how many pages a user browses on average during one visit. This metric helps assess content relevance, site navigation, and user exploration depth.
Bounce Rate
Represents the percentage of users who leave after entering the website without visiting other pages. A high bounce rate doesn't necessarily mean poor experience: users may leave immediately after finding their answer on one page. Therefore, it should be analyzed together with page purpose, visit duration, and conversion data.
Traffic Sources
Common sources include direct access, organic search, paid search, referral, social media, display ads, and email. Channel structure can reflect what methods a brand primarily relies on for customer acquisition, and whether it is overly dependent on a single channel.
Top Pages
Top pages reveal which products, articles, or landing pages are actually receiving traffic. When analyzing competitors, top pages often have more actionable value than total homepage traffic, because they directly tell you "what content or products are driving growth".
Similarweb Main Features
Similarweb's product modules vary by plan and region. According to its 2026 official website information, the platform now covers product lines including Web Intelligence, AI Search Intelligence, App Intelligence, Retail Intelligence, Sales Intelligence, and Stock Intelligence. For most marketing and SEO users, the most commonly used features fall into the following categories.
Website Analysis
After entering a domain, view website overview including:
- Total visits and monthly trends;
- Visit duration, pages per visit, and bounce rate;
- Desktop and mobile distribution;
- Country and region distribution;
- Channel composition;
- Top pages and website category;
- Similar sites and competitor sites.
Website analysis is suitable for establishing first-level understanding: how large is this website, what are its main markets, is growth stable, and what channels does it rely on for customer acquisition.
Competitive Analysis and Benchmark Comparison
Comparing yourself with multiple competitor sites on the same chart allows you to observe:
- Who leads in overall traffic;
- Who is growing fastest;
- Each brand's share across different channels;
- Which competitor has advantages in specific countries or devices;
- Whether market share has changed recently.
It is recommended not to add too many websites at once. Comparing 3-5 core competitors first makes it easier to identify real differences.
Search and Keyword Intelligence
The Search module can be used to research organic and paid search, including keyword traffic, keyword gaps, ranking changes, search intent, landing pages, and competitive intensity.
Common use cases:
- Enter competitor domain;
- Filter by organic or paid search;
- View keywords driving the most traffic;
- Identify keywords where competitors rank but you have no coverage;
- Return to SERP to confirm content types and search intent;
- Then decide whether to create articles, product pages, or topic pages.
Market Research
Market Research focuses not just on individual websites, but on a category or industry. It can be used to observe market size, top websites, share changes, growing brands, and user demand.
This feature is suitable for answering: "Should we enter this market?" "Have top brands already monopolized it?" "Is growth coming from the entire industry, or just from one company's strategy?"
App Intelligence
App Intelligence is primarily used for mobile app research, allowing you to view app rankings, download trends, activity levels, usage patterns, and performance of similar apps. For brands operating both websites and apps, Web and App data should be analyzed together to avoid seeing only half of the user journey.
AI Search Intelligence
As users increasingly find answers through generative AI, Similarweb has added capabilities for AI traffic trends, brand visibility, popular landing pages, and prompt analysis. Businesses can use it to observe whether their brand is mentioned in AI responses, which questions drive visits, and competitor visibility in AI search.
This data is still rapidly evolving and is better suited for trend monitoring and opportunity discovery, rather than replacing traditional search, conversion, and brand research data.
Dashboards, API & Data Integration
Paid teams can build custom dashboards, share reports, and integrate data into BI tools, data warehouses, or internal workflows. Enterprise editions typically also offer longer historical data, more granular country and page-level insights, APIs, single sign-on, and custom support.
How to Analyze a Competitor
Below is a 20-minute analysis process suitable for first-time users.
Step 1: Define Analysis Scope
First record the following conditions to avoid comparing data with different metrics:
- Country or region;
- Desktop, mobile, or all devices;
- Last 3 months, 6 months, or 12 months;
- Entire domain, subdomain, or specific directory;
- Organic search, paid search, or all channels.
Step 2: Review Overall Trends
First look at 6–12 months of visit volume, not just a single month. Focus on:
- Whether there is long-term growth;
- Whether there is obvious seasonality;
- Whether peaks correspond to campaigns, promotions, or new product launches;
- Whether recent month changes are just short-term fluctuations.
Step 3: Break Down Channels
Identify the competitor's top two channels, then dig deeper. For example:
- High organic search share: research keywords, content structure, and popular pages;
- High paid search share: research ad keywords and landing pages;
- High social media share: research main platforms, content formats, and campaign rhythm;
- High referral traffic share: research media, affiliates, navigation sites, or partners.
Step 4: Check Popular Pages
Categorize popular pages by purpose: product pages, category pages, blog articles, tool pages, campaign pages, or login pages. What you're looking for is not "which page to copy," but what needs the competitor satisfies and what page types they use.
Step 5: Compare with Yourself
Create a simple gap table:
| Dimension | Yourself | Competitor | Gap | Next Action |
|---|---|---|---|---|
| Overall traffic trend | ||||
| Organic search | ||||
| Paid search | ||||
| Social traffic | ||||
| Popular content | ||||
| Key countries |
Step 6: Form Actionable Conclusions
A good competitive analysis shouldn't stop at screenshots and numbers, but should produce clear actions, such as:
- Complete landing pages for 10 high-intent keywords;
- Create localized pages for a specific growth market;
- Test channels that competitors haven't fully utilized;
- Transform high-traffic but low-conversion content into product entry points;
- Track channel share of 5 competitors monthly on a fixed schedule.
How to choose between Free and Paid versions
When is the free version suitable
Similarweb's official website provides partial free data and a browser extension. The free version is suitable for:
- Occasional checks of approximate traffic for a specific website;
- Quick assessment of website scale and primary markets;
- Viewing basic rankings and channel overviews;
- Familiarizing yourself with the interface and metrics before purchasing.
Free data represents high-level samples of platform capabilities, with limited time ranges, result quantities, countries, keywords, and depth typically available.
When do you need the paid version
The paid version becomes more valuable when:
- You need continuous monitoring of multiple competitors;
- You need longer historical data and finer granularity by geography, device, or page;
- You need keyword gap analysis, advertising intelligence, conversion analysis, or AI search intelligence;
- You need to export large amounts of data, create team dashboards, or access APIs;
- Analysis results will directly impact budget, market entry, or product decisions.
Similarweb's current enterprise solutions focus on bundled product packages and sales consultations, with specific features and prices varying by product, data scope, seats, and contract terms. Before purchasing, refer to theofficial pricing pageand sales quotes for accurate information; fixed prices from third-party articles are not recommended for long-term reference.
Differences from other analytics tools
| Tool | Best at solving | Data focus | Typical users |
|---|---|---|---|
| Similarweb | How markets, industries, and competitive websites perform | External estimated traffic, channels, market share, audiences, and competitors | Marketing, strategy, growth, and SEO teams |
| Google Analytics | What users do after entering your own website | First-party behavior and event data from owned websites | Website operations, product, and data analytics teams |
| Semrush | How to execute comprehensive SEO and search marketing work | Keywords, rankings, site audits, backlinks, and advertising research | SEO, content, and search advertising teams |
| Ahrefs | How to deeply research keywords, content, and backlinks | Backlink database, keywords, rankings, and content opportunities | SEO, content marketing, and backlink teams |
Similarweb vs. Google Analytics
They are not replacements for each other.
- Google Analytics is based on tracking code deployed on your own website, suitable for precise analysis of owned properties;
- Similarweb estimates markets and competitive websites through external data and models, suitable for comparative analysis;
- Best practice is to use Similarweb to discover market opportunities, then validate your own user behavior and conversion results with GA4.
Similarweb vs. Semrush
Semrush is more like a comprehensive marketing tool covering SEO, content, advertising, and site diagnostics; Similarweb emphasizes more on full-channel traffic, market share, and competitive landscape. If your focus is daily SEO execution, Semrush may be more convenient; if you need to explain industry and competitor changes to management, Similarweb is often more intuitive.
Similarweb vs. Ahrefs
Ahrefs excels in backlink, keyword, and content research; Similarweb's strengths lie in overall website traffic, channel structure, audience, and market analysis. SEO teams often use both together: Similarweb to determine "what's driving competitor growth," then Ahrefs to dig deeper into "which specific keywords and backlinks are actually working."
Pros and Limitations
Similarweb Pros
- Complete market perspective: Not just SEO, but also compares direct visits, ads, social, referral, and other channels.
- Intuitive competitor comparison: Charts and share data are great for quick reporting and communication.
- Broad scenario coverage: From websites and apps to retail, sales, and AI search intelligence, there's a corresponding product for each.
- Fast onboarding: Enter a domain to get an overview—no need to deploy code on the other party's website.
- Good for trend research: Can identify growth, seasonality, channel shifts, and market share changes.
Similarweb Limitations
- Competitor website data is estimated: Cannot replace the other party's real backend data.
- Small websites may have insufficient samples: The smaller the traffic and the narrower the market, the more common data gaps or fluctuations become.
- Different platforms use different metrics: Don't directly mix numbers from Similarweb, GA4, and ad backends.
- Free version has limited depth: Serious ongoing research usually requires paid access.
- Enterprise features are costly: Teams should clarify decision scenarios before purchasing corresponding modules.
- Features change quickly: Packages, product names, and AI-related capabilities should be verified against real-time information on the official website.
Three Common Misconceptions When Using Similarweb
Misconception 1: Treating estimated traffic as absolute truth
The correct approach is to look at relative scale, trends, and channel share. Don't draw conclusions easily if two websites differ only slightly; conclusions are more reliable when there's a long-term order-of-magnitude difference.
Misconception 2: Only looking at total visits
Total volume doesn't explain growth drivers. You should at least also check country, device, channel, keywords, and top pages.
Misconception 3: No action after analysis
The endpoint of competitive analysis isn't a report—it's priorities. Each analysis should output 3–5 actionable items, with clear owners, expected metrics, and review timelines.
FAQ
How accurate is Similarweb data?
It's generally more valuable for medium-to-large websites, mainstream markets, and trend judgments; for websites with very low traffic, extremely niche regions, or newly launched sites, estimation errors may be larger. We recommend using multiple time periods and cross-validating with search results, ad materials, social data, and internal data.
Can Similarweb be used for free?
Yes. The official website allows viewing partial website data, and there's also a free browser extension. However, free features have limited historical range, result count, and analysis depth—suitable for quick queries, not for long-term, systematic competitive monitoring.
Can Similarweb see competitors' real sales figures?
Usually cannot directly see real financial data. The platform can provide insights on traffic, conversion, and market trends; some industry products give estimated metrics, but these are not equivalent to actual revenue disclosed by companies.
Can Similarweb replace GA4?
No. GA4 is for analyzing your own website and conversions; Similarweb is for observing markets and competitors. Their data sources, metrics, and goals are different.
How long should you look at when analyzing competitors?
Generally recommend at least 6 months, ideally covering 12 months. For industries with obvious seasonality like e-commerce, travel, and education, single-month data can easily lead to misjudgments.
Which websites are not suitable for Similarweb analysis?
Websites with very low traffic, sites serving extremely small regions, platforms where most traffic occurs after login or in private domains, and newly launched sites usually lack sufficient publicly visible signals and should be interpreted with caution.
Summary
The core value of Similarweb is transforming previously invisible competitor websites and market activities into comparable data. It is best suited to answer three questions:
- What changes are happening in the market;
- What is driving competitor growth;
- Where should we allocate resources next.
If you only occasionally check a specific website, the free version already provides basic reference; if you need long-term competitor monitoring, multi-country research, keyword and ad analysis, or data integration into team workflows, then consider paid plans.
Regardless of which version you use, remember:Use Similarweb to discover direction, use first-party data to validate results, and use business objectives to determine action.
References
- Similarweb Official Website (Simplified Chinese)
- Similarweb Web Intelligence Plans and Pricing
- Similarweb Data Methodology
- Reference Article: What is Similarweb? Complete Guide to Features and Pricing
This article is original content, referencing the information architecture of the target article and rewritten based on Similarweb's official 2026 pages. Illustrations are original AI infographics; interfaces and data are for demonstration purposes only and do not represent Similarweb's actual product interface or real-time data.
Further Reading and Next Steps
- Similarweb Free vs Paid: Feature and Limitation Comparison
- How Accurate is Similarweb Data? Public Website Traffic Validation Experiment
- Complete Competitor SEO Analysis with Similarweb + Semrush
- View RelayX's Current Similarweb Plan
Sources and Verification Notes
This article was reviewed by the RelayX Editorial Team on August 24, 2026 based on the following official materials. Product features, quotas, and pricing are subject to change; when making purchase decisions, please verify against official pages and RelayX's real-time product listings.