
TL;DR
Three ideas before you begin
- Compare sites only under identical filters
- Prioritize trends and shares instead of treating estimates as exact counts
- Connect channel findings to a verifiable next step
Before you start
Prepare the inputs
- Prepare three to five comparable website domains
- Choose the target market, device scope, and observation period
- Write one market or channel hypothesis to test
Step 1
From “Build a comparable competitor set” to “Lock filters and measurement scope”
To produce “A consistently scoped brief on competitor traffic, channels, and market opportunities”, make “Build a comparable competitor set” and “Lock filters and measurement scope” a reviewable starting point. Every later filter and judgment should preserve this scope.
- 1.1
Build a comparable competitor set
Separate direct, search, and attention competitors, keeping only sites with similar models and audiences in the primary set.
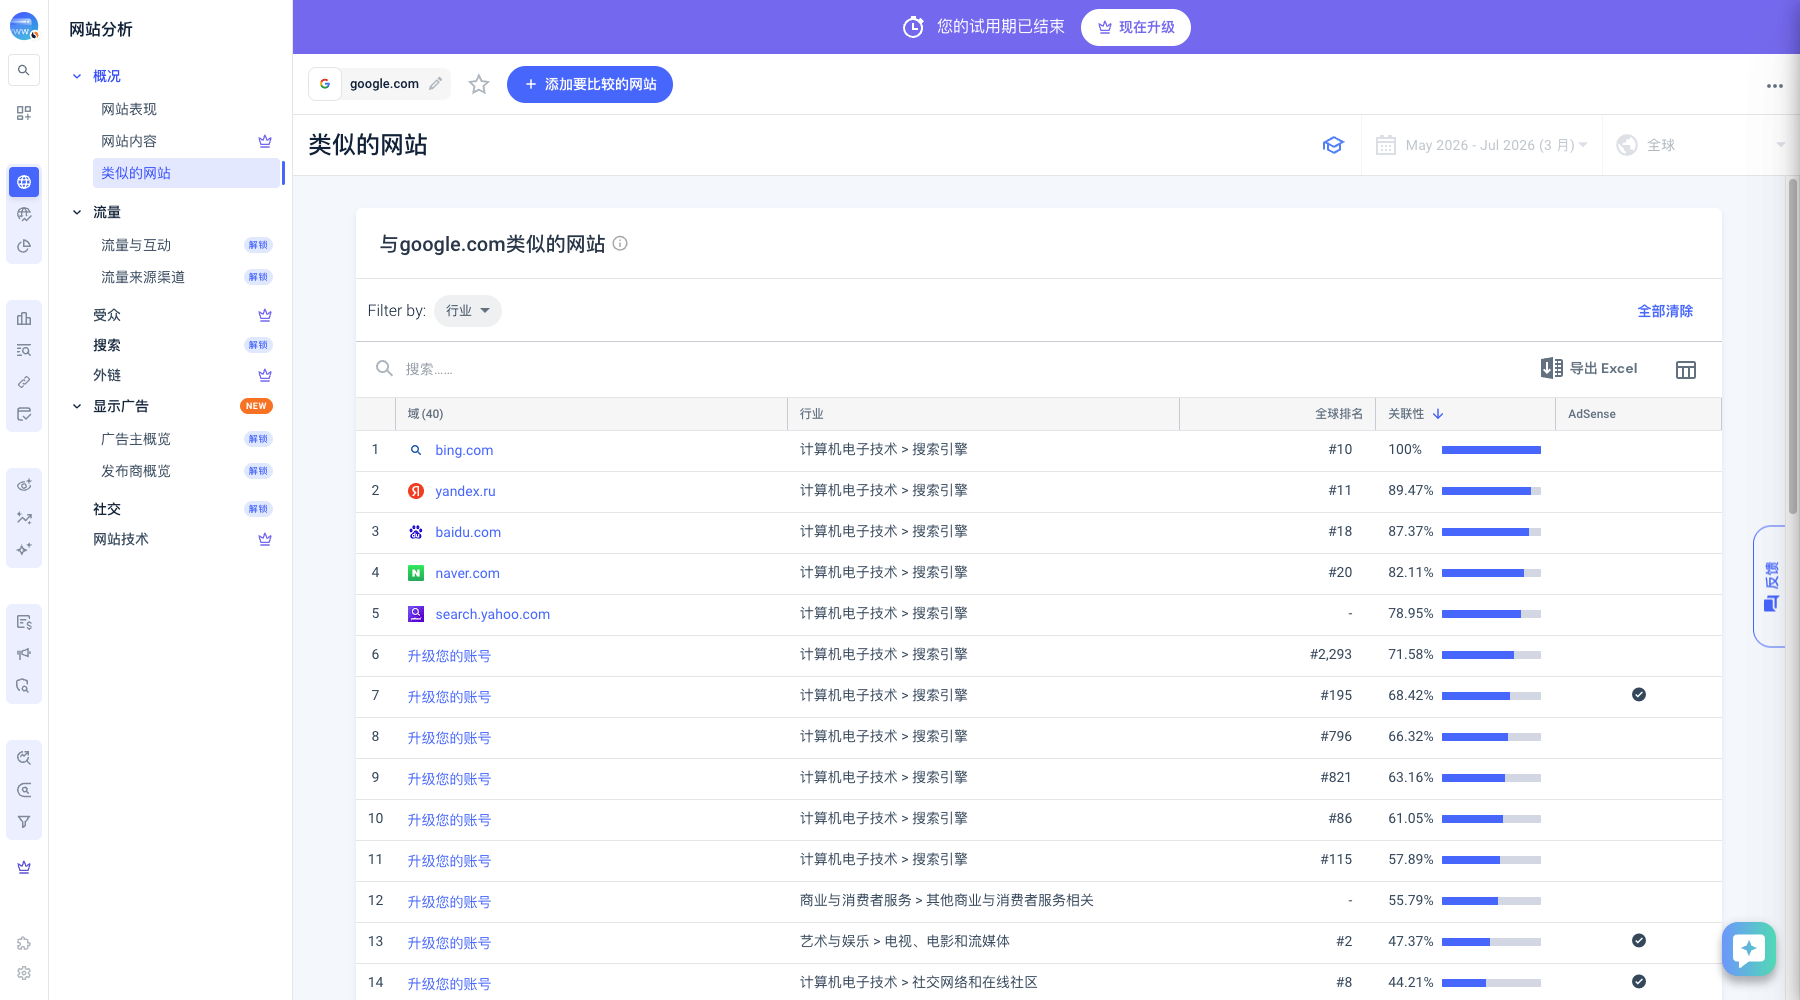
Build a candidate competitor set from recommendations, then manually remove non-comparable sites. Markers- 1 Industry filter
- 2 Report search
- 3 Global rank
- 4 Affinity
System recommendations only expand the candidate pool. Use industry and affinity to find sites, then manually verify business model, audience, and market comparability.
Verify source: Similarweb Similar Sites report - 1.2
Lock filters and measurement scope
Use the same period, country, and device scope for every site and note whether each figure is modeled or verified.
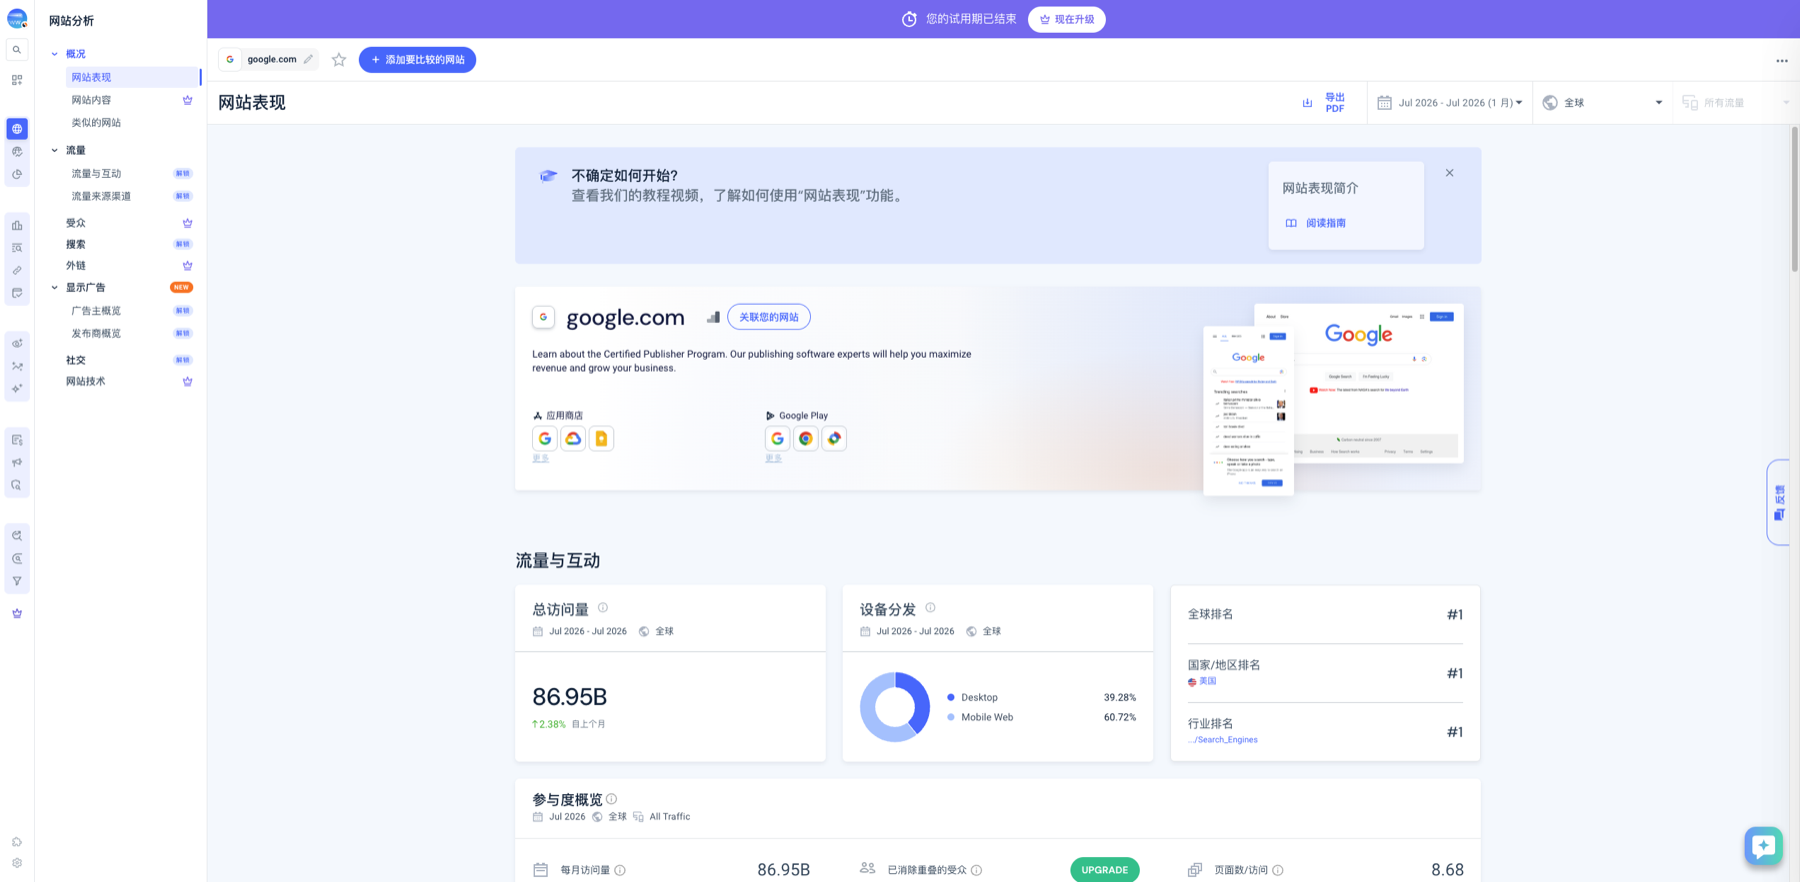
Lock the top-right filters before comparing competitors. Markers- 1 Current domain
- 2 Date range
- 3 Geography
- 4 Visits baseline
Website Performance is the report overview. Lock the domain, date, geography, and traffic scope before reading visits, device mix, and engagement. These are modeled estimates, so prioritize trends.
Verify source: Similarweb website performance interface
The brief cover now states the competitor set, filters, and data limitations.
Step 2
“Read scale, trend, and engagement first”, then “Break down channels, geography, and similar sites”
Keep only the evidence needed for “Read scale, trend, and engagement first” and “Break down channels, geography, and similar sites”. Record why each filter changes so the result remains reproducible instead of becoming an unexplained screenshot.
- 2.1
Read scale, trend, and engagement first
Read visit trends together with duration, pages per visit, and bounce behavior rather than judging from one month of visits alone.
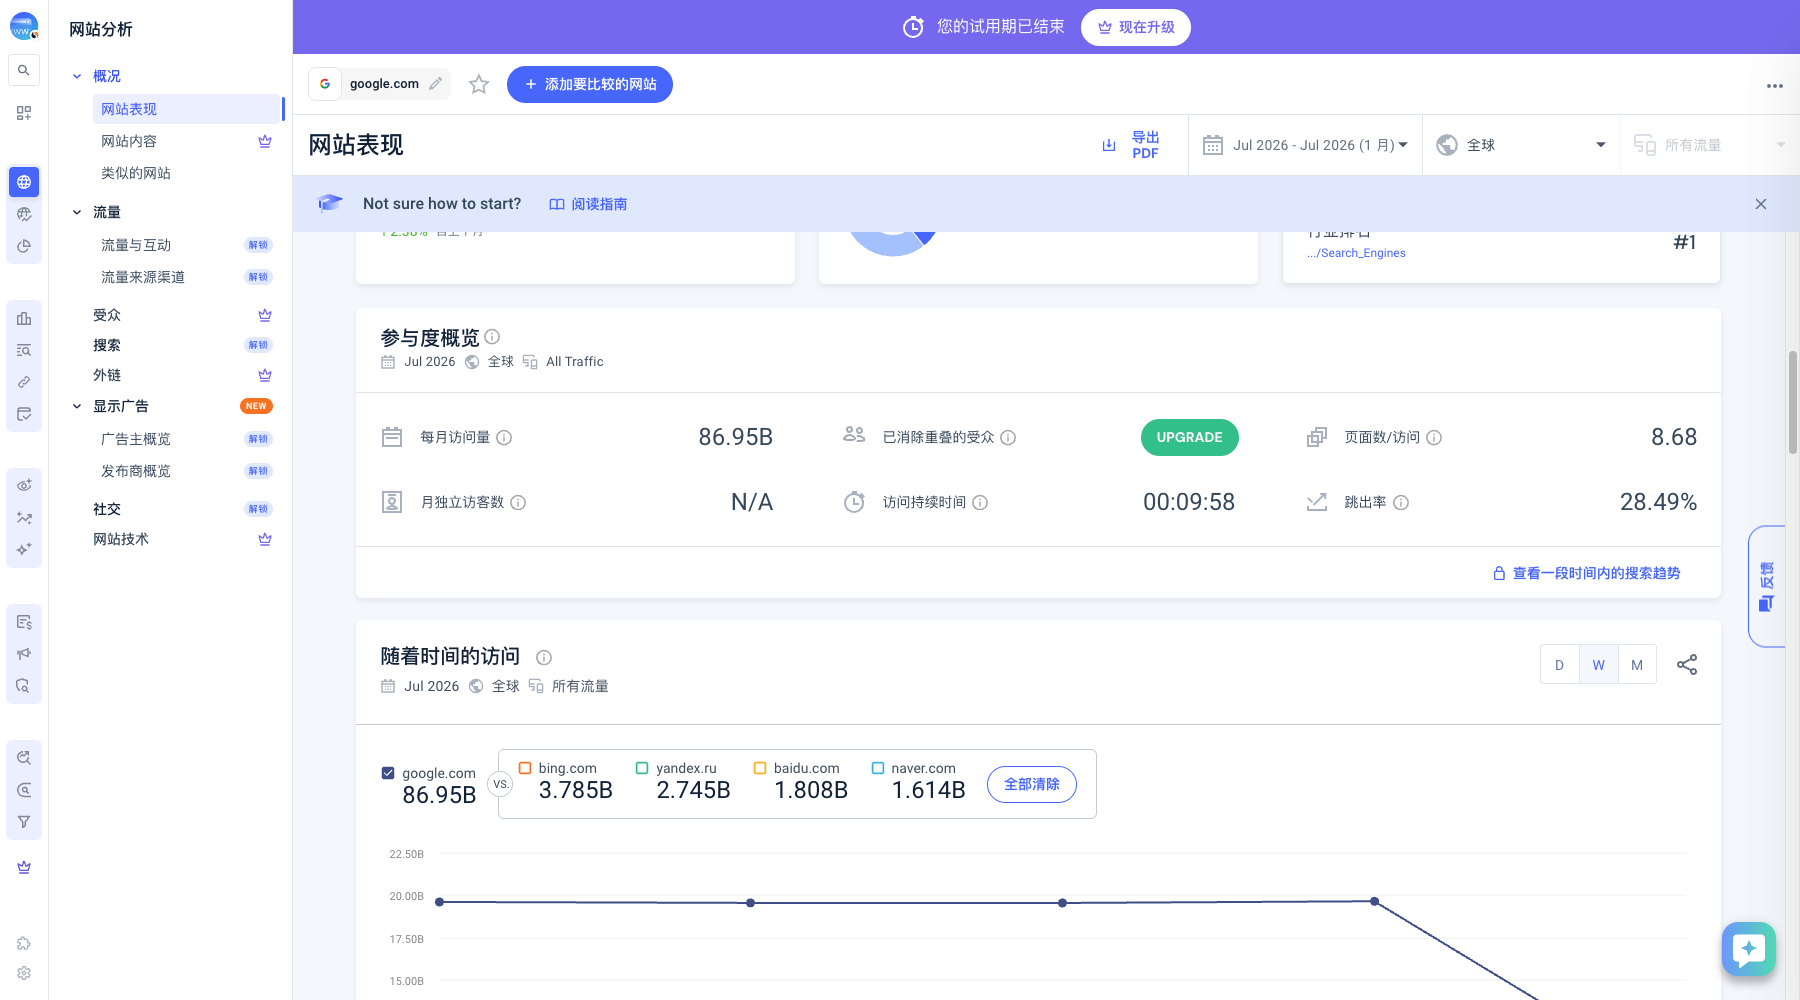
Combine scale, engagement, and trend in one judgment. Markers- 1 Engagement metric group
- 2 Competitor trend comparison
- 3 Traffic report entry
Read visits, duration, pages per visit, and bounce rate together, then compare competitors on the same trend scope. One improved metric does not prove the whole experience improved.
Verify source: Similarweb Website Performance: engagement and trend - 2.2
Break down channels, geography, and similar sites
Identify the largest and fastest-growing channels, verify target-market traffic, and add relevant competitors surfaced by the platform.
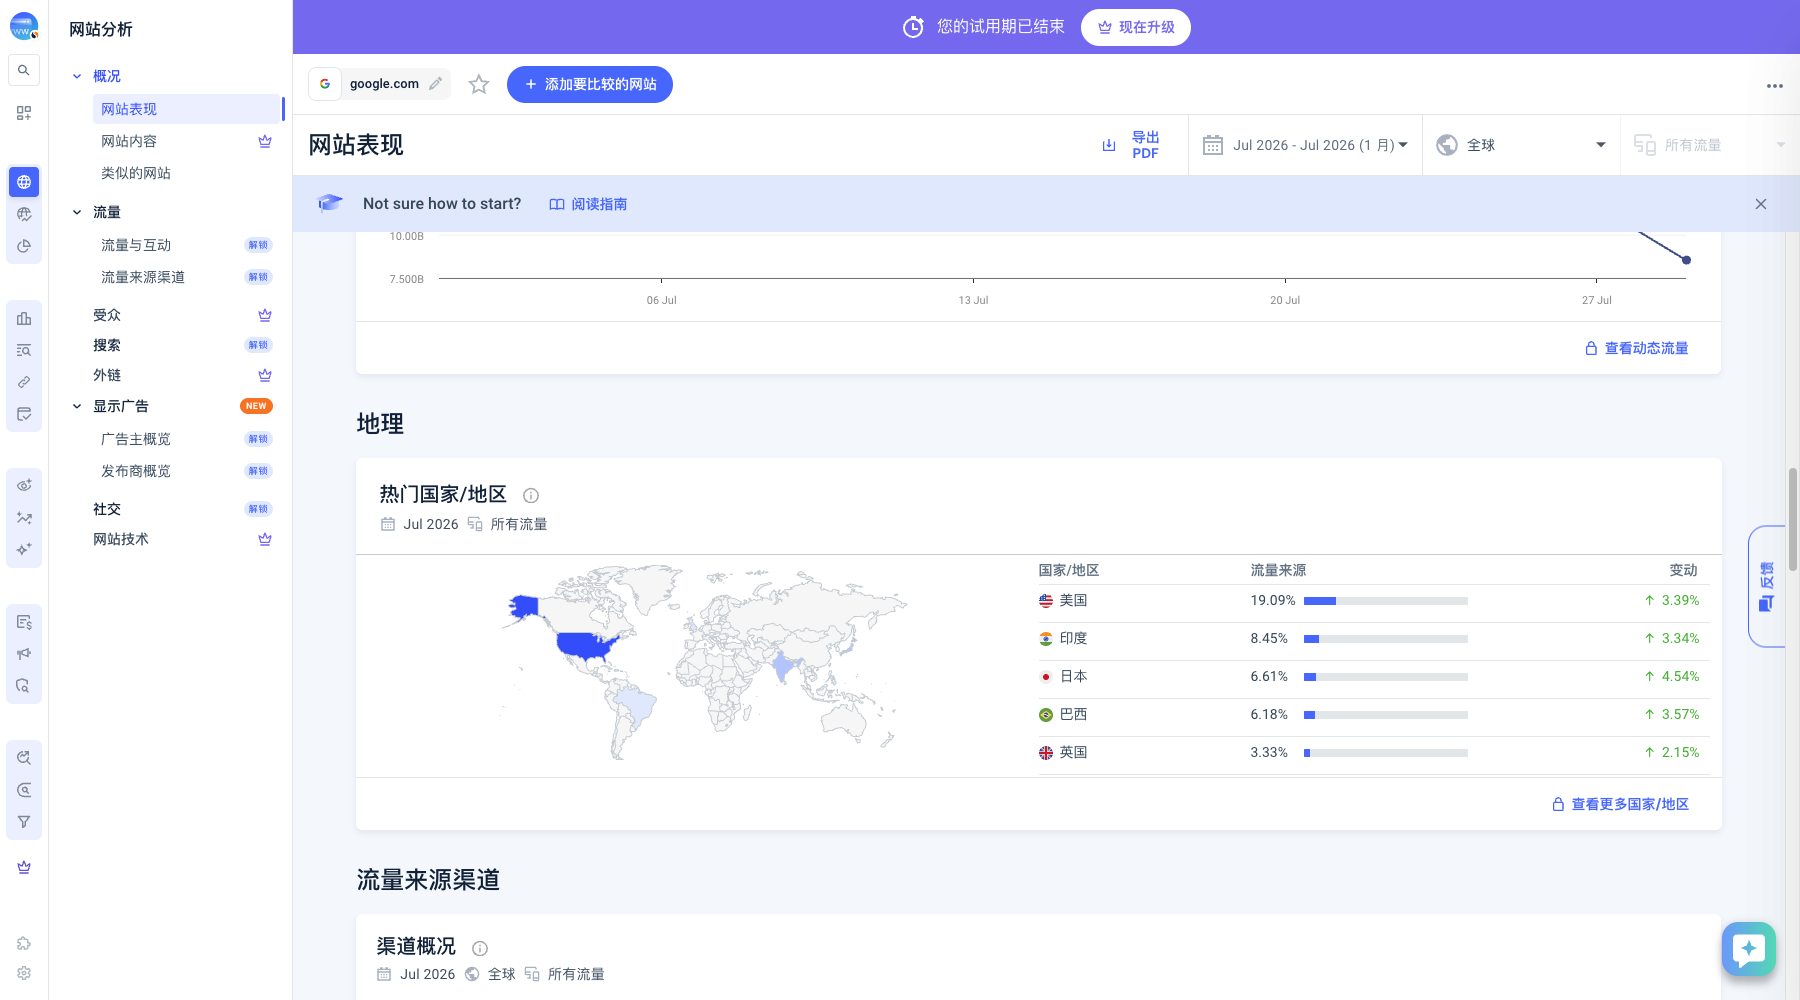
Confirm that traffic actually comes from the target market. Markers- 1 Geographic distribution map
- 2 Country traffic share
- 3 Share change
The map is for orientation; the table provides comparable evidence. Check whether the target market ranks meaningfully, then review share and change instead of assuming opportunity from global scale.
Verify source: Similarweb Website Performance: top countries and regions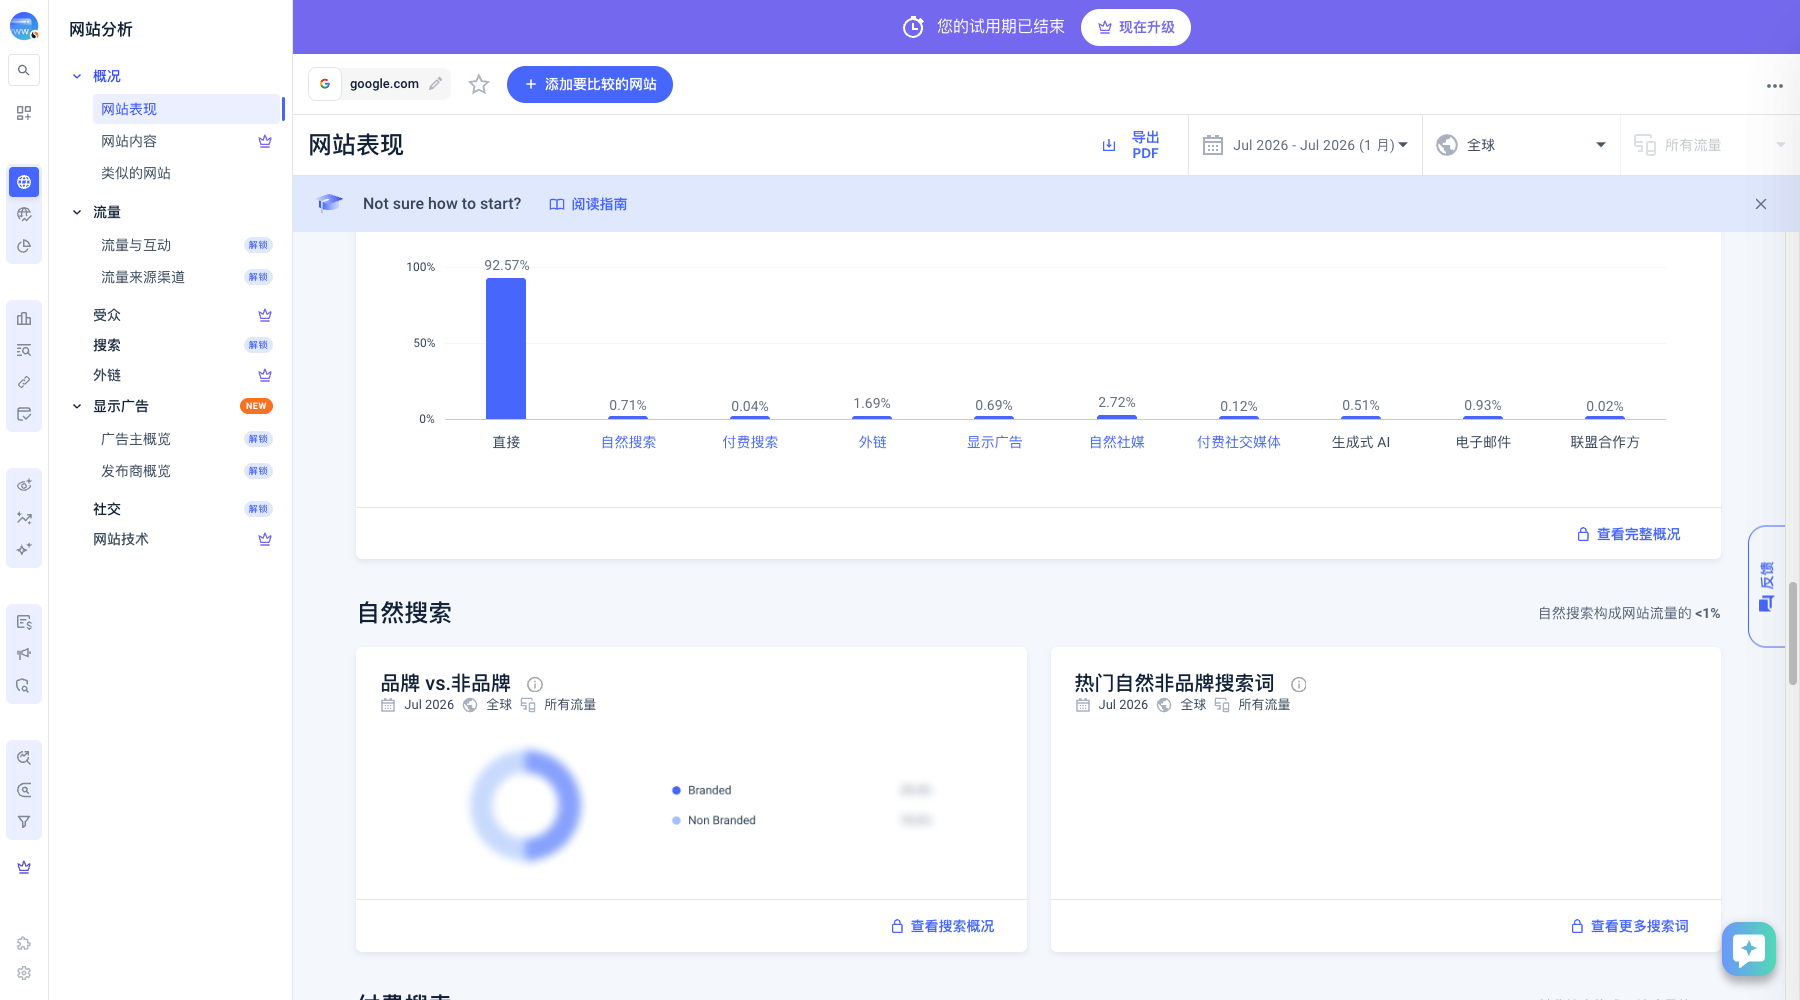
Identify the largest and most testable channels instead of spreading effort evenly. Markers- 1 Direct traffic
- 2 Search channels
- 3 Social and AI channels
- 4 Branded vs non-branded search
Compare channel share first, then open the relevant report for keyword, referral, social, or ad evidence. The channel chart shows where traffic comes from, not why.
Verify source: Similarweb Website Performance: channel overview
Every competitor now has a one-sentence diagnosis backed by a time range and channel evidence.
Step 3
“Validate high-potential channels” and “Turn conclusions into a small experiment”
Do not stop at tool output. Use “Validate high-potential channels” and “Turn conclusions into a small experiment” to verify quality, limitations, and ownership so “A consistently scoped brief on competitor traffic, channels, and market opportunities” becomes actionable.
- 3.1
Validate high-potential channels
Use owned analytics, search tools, ad evidence, or public pages to validate the keywords, content, partnerships, or campaigns behind a channel.
- 3.2
Turn conclusions into a small experiment
Assign an owner, budget, two-week action, and success metric to the strongest opportunity instead of stopping at screenshots.
The brief ends with testable opportunities, risks, and the next review date.
WHO · HOW · WHY
How this guide was written and reviewed
- Who
- Independently written and manually reviewed by the RelayX Editorial Team, with update and capture dates shown on the page.
- How
- Fix geography, time, device, and domain scope first, then cross-check third-party estimates with owned analytics, search-console data, or public pages. No single traffic or authority score is treated as a business result.
- Why
- The goal is not to restate product features but to help you produce “A consistently scoped brief on competitor traffic, channels, and market opportunities”. The workflow is organized around that outcome with checkpoints, limitations, and next actions.
Interface captures come from official accessible product pages or the current browser interface. Each appears under its matching step with numbered controls and data points. When real functional UI cannot be publicly verified, the guide says so instead of using a marketing homepage as filler. No third-party tutorial text or imagery is reused; third-party brands and interface rights remain with their respective owners.