
TL;DR
Three ideas before you begin
- Give each tool one class of question to answer
- Advance through evidence gates and stop weak signals early
- Turn the final conclusion into a test and an owner
Before you start
Prepare the inputs
- Define one target country or region and product category
- Prepare three to five direct competitors or representative stores
- Write down the price, audience, and channel assumptions to validate
Step 1
Start with a falsifiable category hypothesis
Define what would make you continue or stop so you do not cherry-pick supporting data afterward.
- 1.1
Define the audience and use case
Describe region, user traits, core problem, and purchase context rather than a broad category name.
- 1.2
Set three evidence gates
Set demand, competition, and acquisition gates such as search trend, competitor growth, creative longevity, and acceptable acquisition cost.
- 1.3
Create one evidence table
Each record should include source tool, date, market, screenshot or link, interpretation, and confidence.
Before research begins, the team should be able to state the conditions for continuing, changing, or stopping.
Step 2
Validate demand and competitor traffic
Confirm that the market and channels exist before examining creatives and product details.
- 2.1
Use Similarweb for channels and geography
Compare visit trends, top countries, channel shares, and similar sites to confirm traffic comes from the target market.
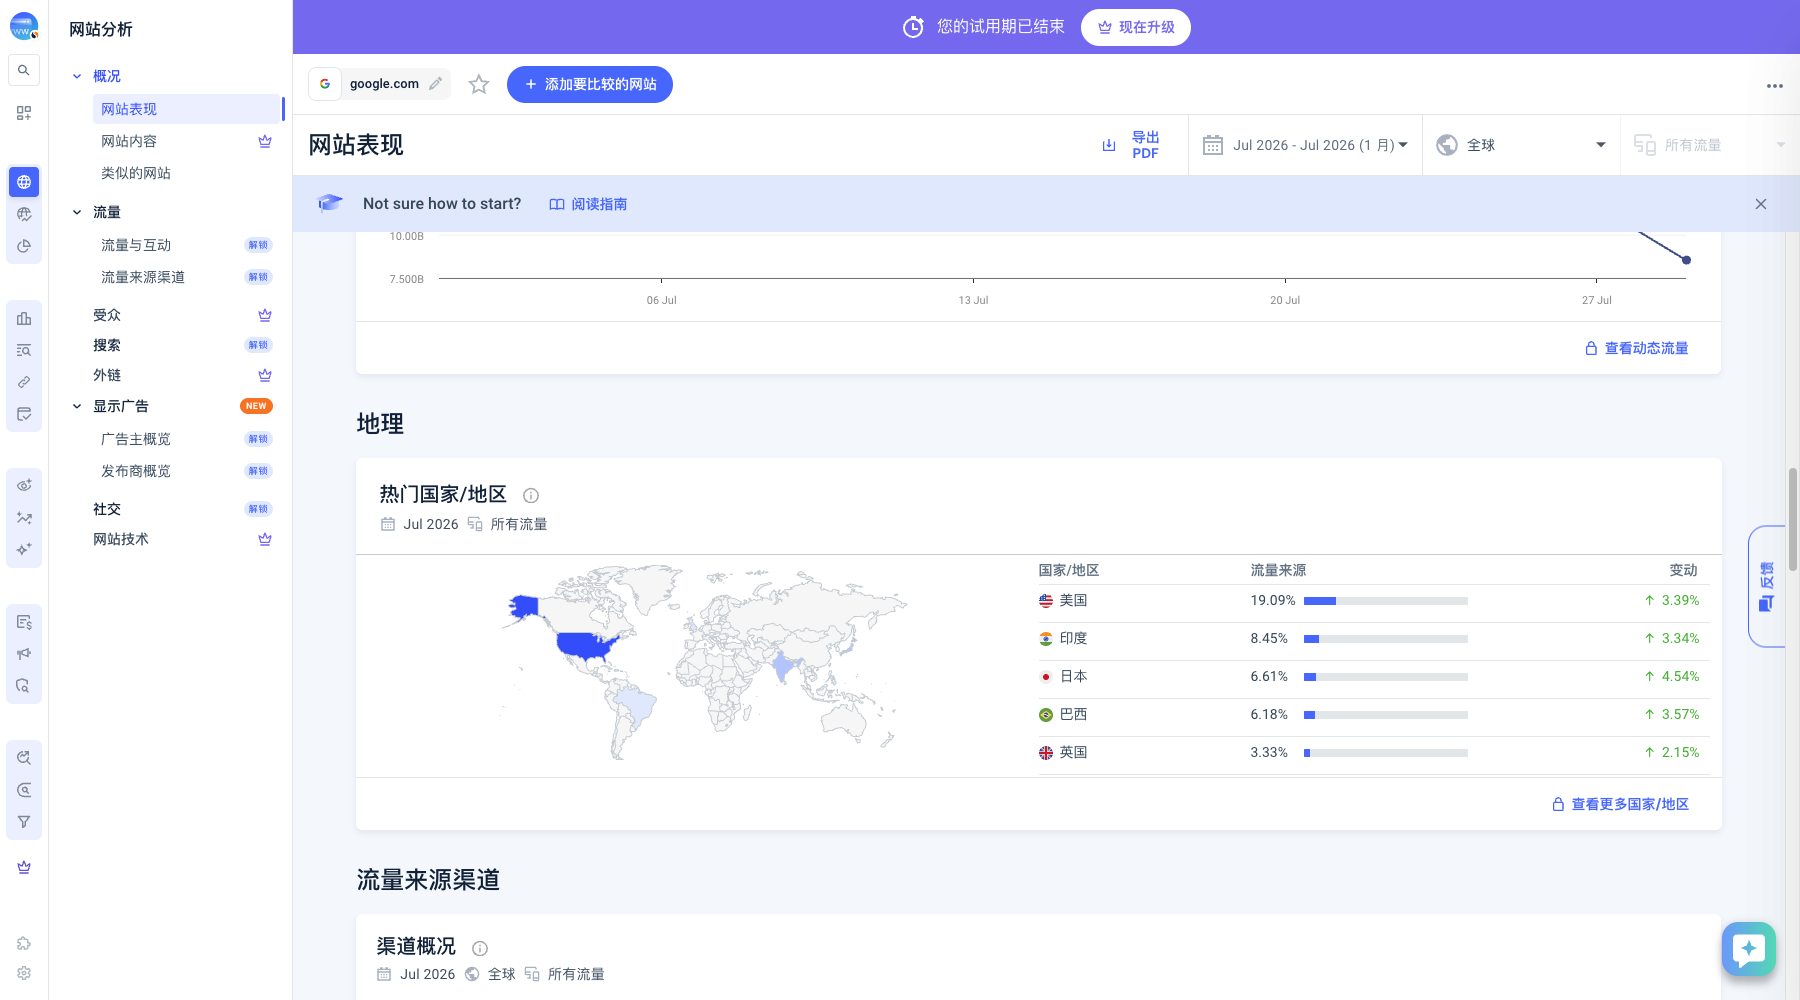
Use geographic share to confirm demand comes from the target market rather than global noise. Markers- 1 Geographic distribution map
- 2 Country traffic share
- 3 Share change
The map is for orientation; the table provides comparable evidence. Check whether the target market ranks meaningfully, then review share and change instead of assuming opportunity from global scale.
Verify source: Similarweb Website Performance: top countries and regions - 2.2
Use Semrush for search demand
Build keyword groups around category, problem, and use case, then review trends, intent, competitor pages, and paid-search signals.
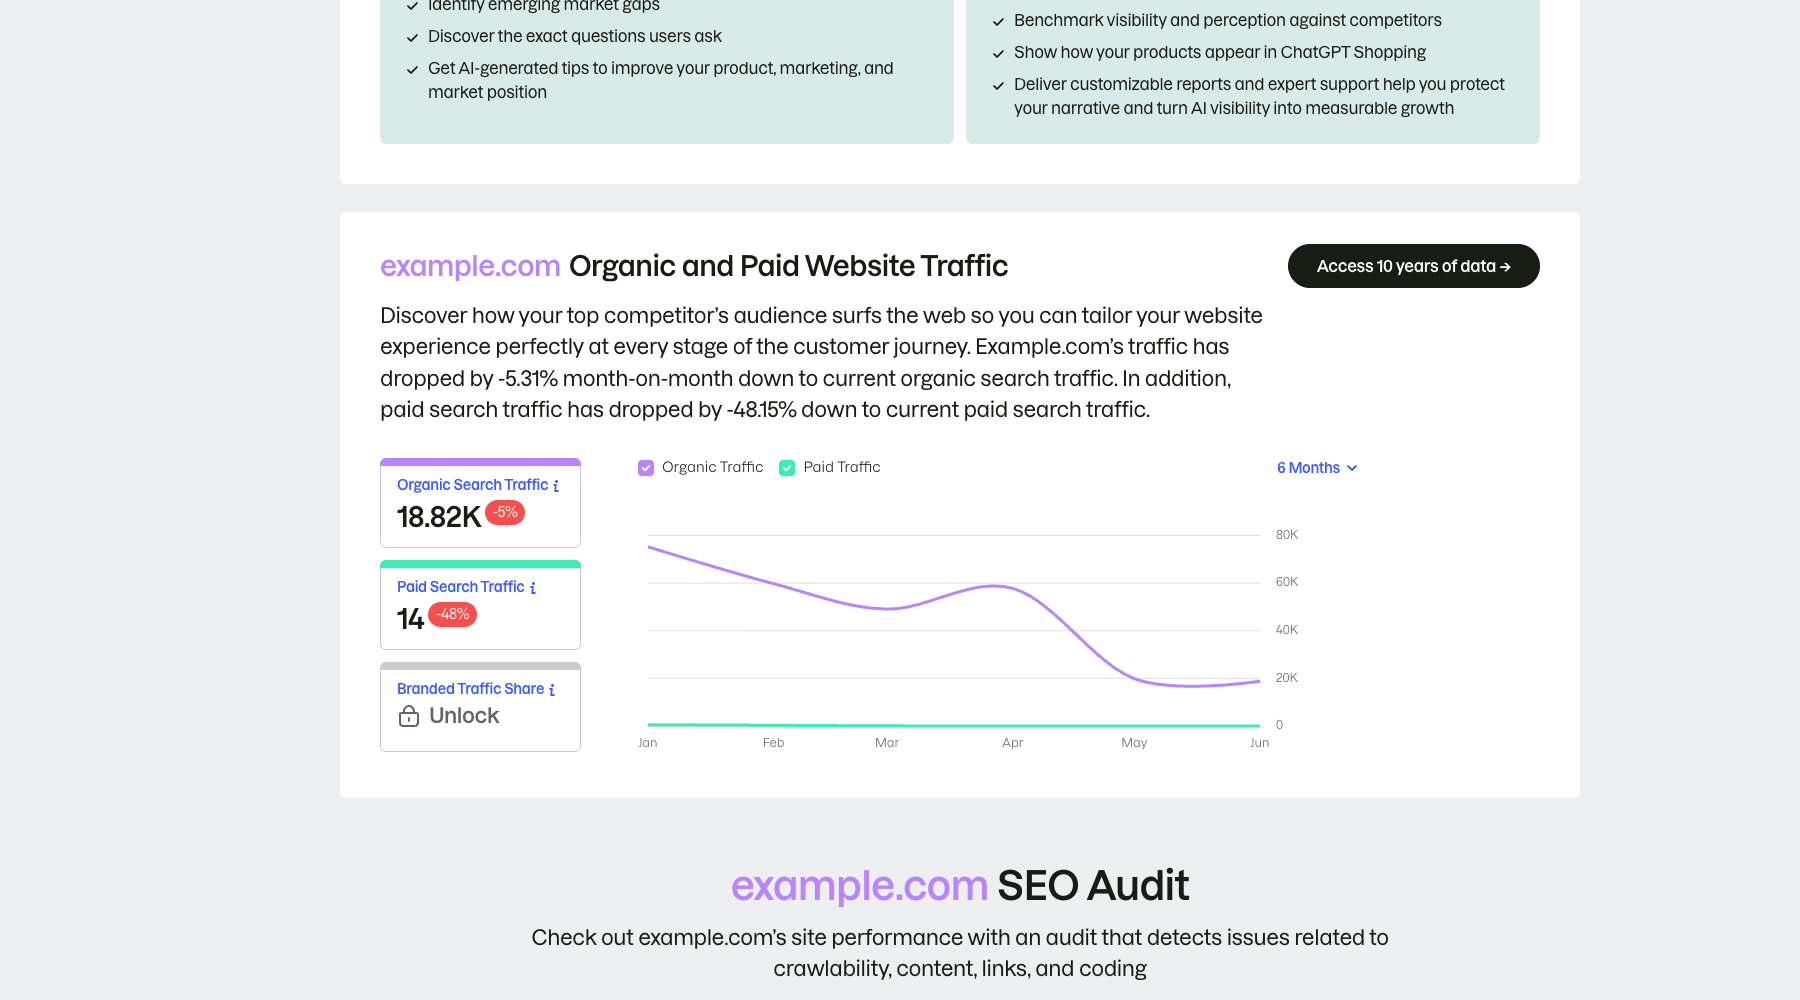
Separate organic and paid search to judge whether demand is stable enough to validate. Markers- 1 Organic search traffic
- 2 Paid search traffic
- 3 Change trend
Separate organic from paid search before comparing their direction of change. The public example explains the interface structure; production research still requires consistent market, device, and date scopes.
Verify source: Semrush official organic and paid traffic report - 2.3
Cross-check rather than add metrics
Confidence rises when traffic and search demand agree. If they conflict, inspect geography, branded traffic, and seasonality.
Only categories that pass the demand gate should move into creative and product research.
Step 3
Analyze ad creative and product supply
This stage asks how competitors communicate value and which product structures show sustained validation.
- 3.1
Build a creative sample with BigSpy or AdSpy
Filter by country, platform, keyword, and run time. Study recurring hooks, contexts, formats, and landing pages instead of copying creatives.
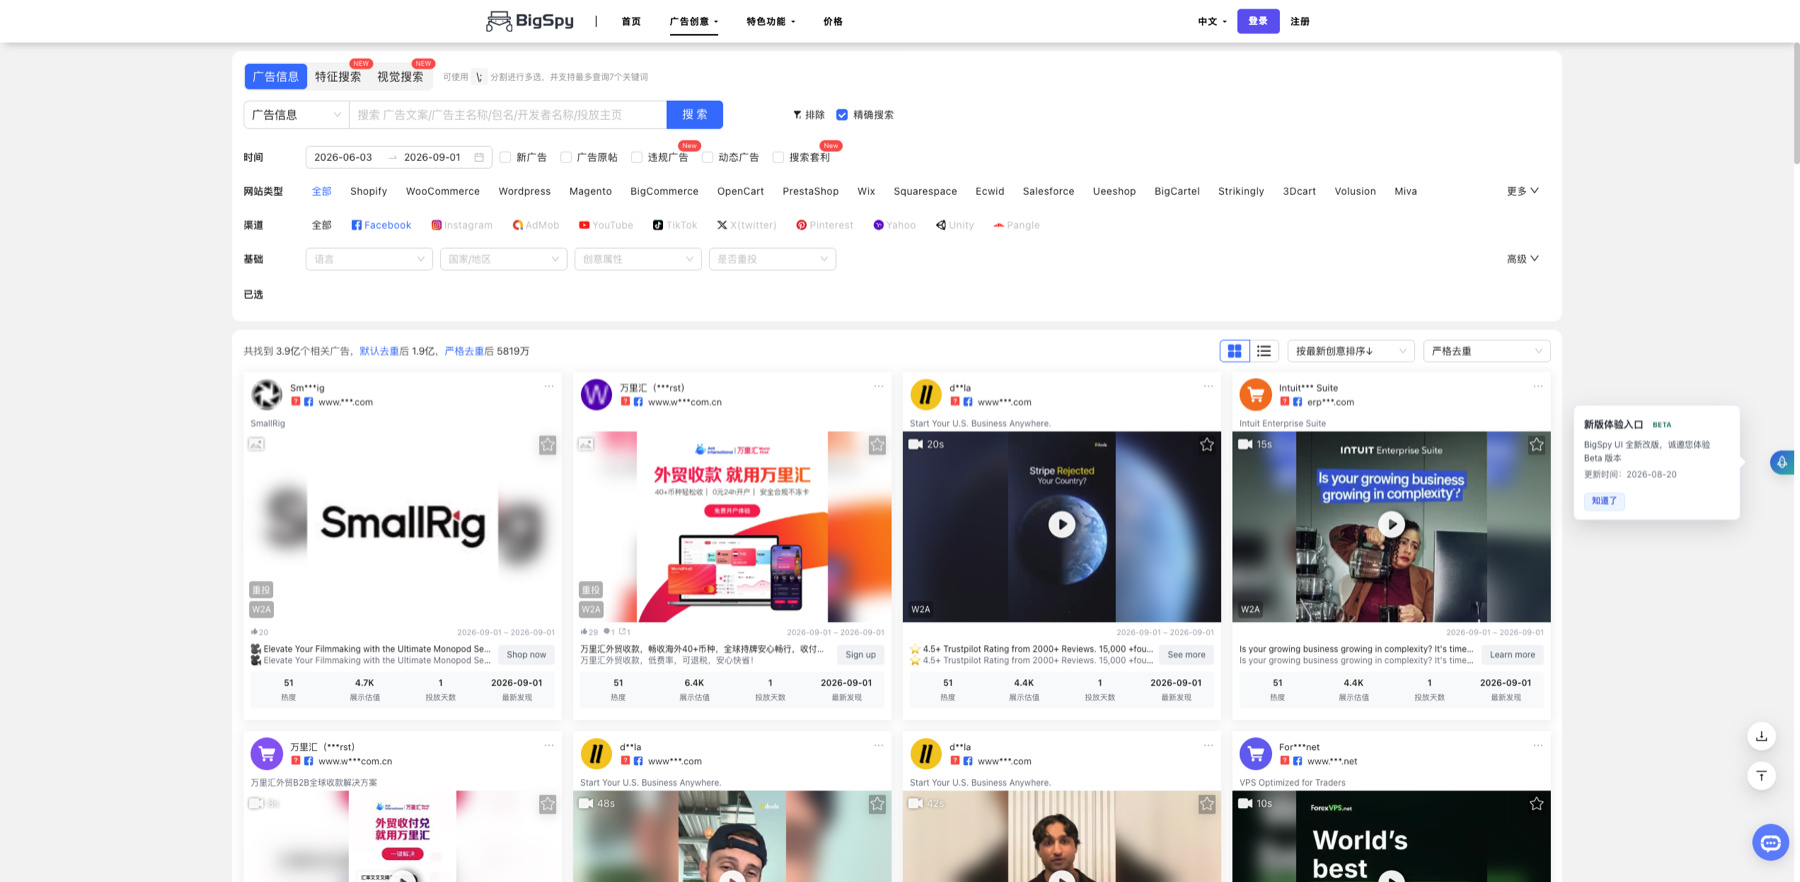
Build an ad sample under consistent filters instead of extrapolating from one high-engagement creative. Markers- 1 Keyword input
- 2 Date range
- 3 Market and base filters
- 4 Ad result cards
Narrow filters according to the research question. Result cards reveal repeated patterns, but engagement and run duration do not prove conversion and are not permission to copy creative.
Verify source: BigSpy official ad search interface - 3.2
Code creative hypotheses
Tag audience, pain point, promise, proof, offer, and CTA so patterns replace subjective “winning ad” judgments.
- 3.3
Check product signals with Helium 10
For Amazon-relevant categories, review keywords, price, reviews, sales estimates, and concentration, noting differences from DTC markets.
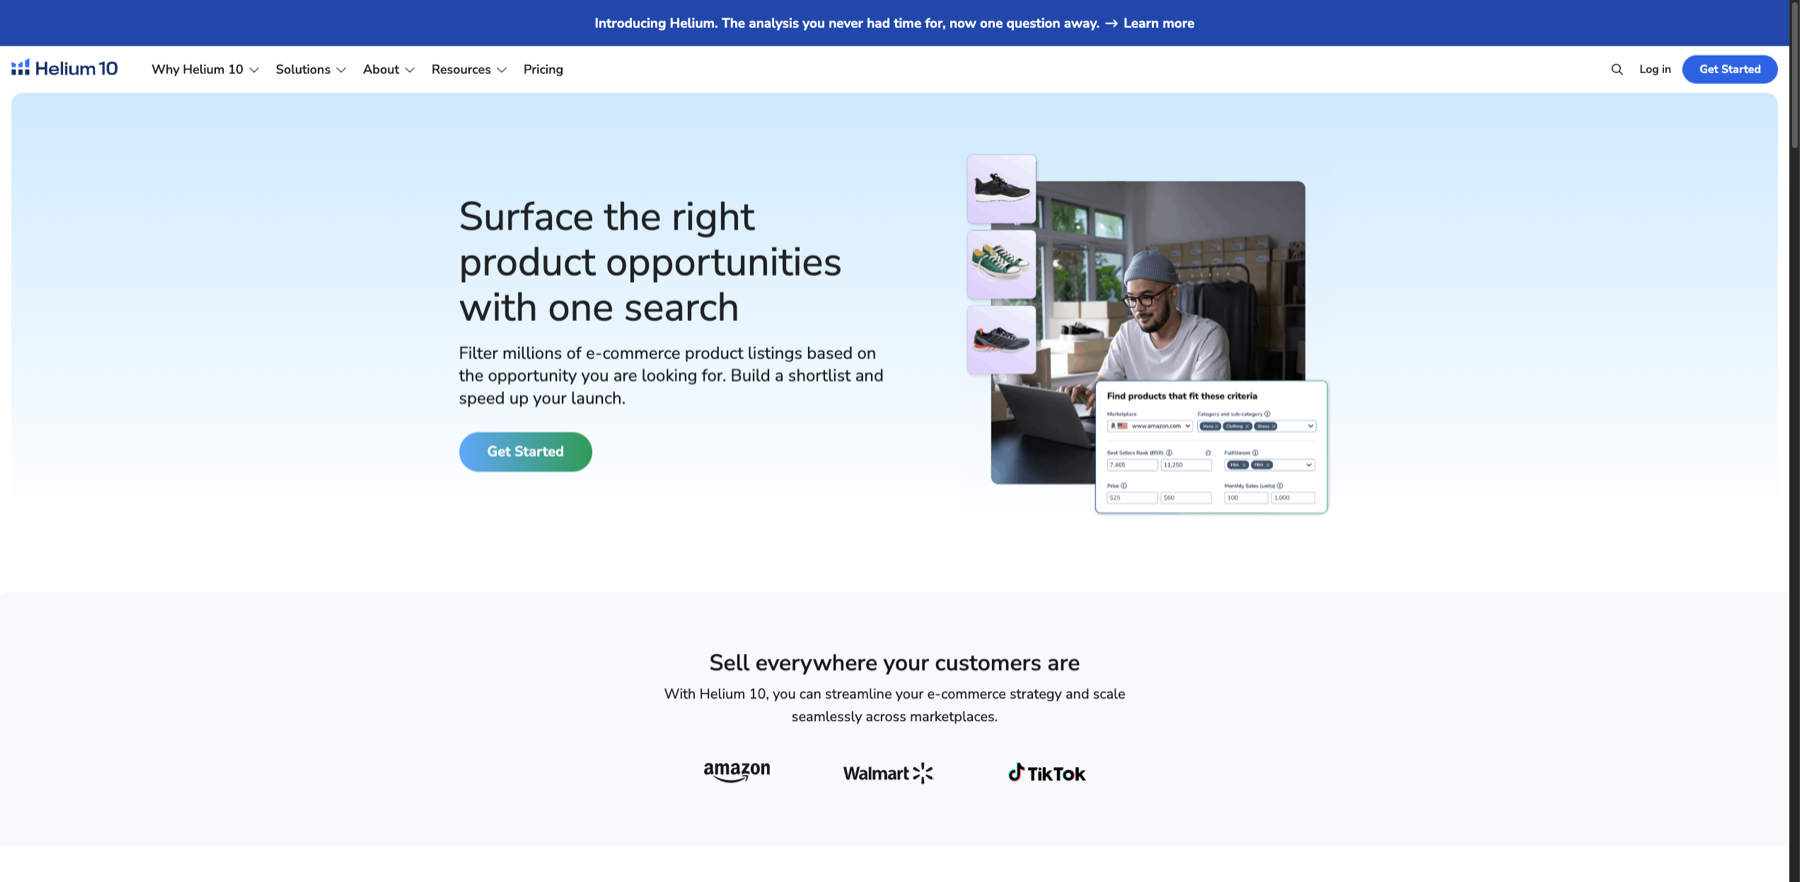
Treat product-filter output as a candidate signal and continue validating margin, inventory, and compliance. Markers- 1 Marketplace and category
- 2 Price range
- 3 Monthly sales range
This is an official feature illustration, not live account output. It only confirms the filter dimensions; real candidates still require account data plus cost, inventory, and compliance checks.
Verify source: Helium 10 official Black Box product page
Produce three testable audience–hook–product combinations, not merely a creative scrapbook.
Step 4
Complete the prospect, channel, and execution path
Whether the model is retail or B2B, research must lead to reachable channels and clear ownership.
- 4.1
Identify channel partners or B2B audiences
When distributors, brand partners, or business buyers matter, use Apollo to build a small validation list by region, industry, size, and role.
- 4.2
Follow data and outreach rules
Collect only necessary business data, follow applicable privacy, marketing, and opt-out rules, and retain source and freshness metadata.
- 4.3
Assign an action to every conclusion
Examples include three landing-page variants, a small-budget creative test, ten partner interviews, or stopping a low-confidence direction.
Every high-priority item on the evidence board should have an owner, budget cap, success metric, and stop condition.
Step 5
Make the final decision from an evidence board
Compress the outputs of every tool into one decision page instead of sending the team through multiple dashboards.
- 5.1
Rate evidence strong, medium, or weak
Mark evidence strong when multiple sources agree and directly match the market; rate single estimates or proxy-market signals lower.
- 5.2
Write the counterargument
Add the strongest counter-evidence for every recommendation so competition, margin, compliance, and execution risks stay visible.
- 5.3
Choose continue, adjust, or stop
Record the date, rationale, next smallest test, and review time so the research remains traceable.
The final output is an evidence board that directs next week’s action, not a feature summary.
WHO · HOW · WHY
How this guide was written and reviewed
- Who
- Independently written and manually reviewed by the RelayX Editorial Team, with update and capture dates shown on the page.
- How
- Treat tool output as candidate evidence, not proof of sales or conversion. Recheck every conclusion against run duration, landing pages, product cost, inventory, and target-market rules.
- Why
- The goal is not to restate product features but to help you produce “A competitor evidence board spanning demand, channels, creative, and execution”. The workflow is organized around that outcome with checkpoints, limitations, and next actions.
Interface captures come from official accessible product pages or the current browser interface. Each appears under its matching step with numbered controls and data points. When real functional UI cannot be publicly verified, the guide says so instead of using a marketing homepage as filler. No third-party tutorial text or imagery is reused; third-party brands and interface rights remain with their respective owners.